-
Notifications
You must be signed in to change notification settings - Fork 1
Scrapie Data
In order to prepare scrapie data, reporting countries need to produce (by querying their respective databases) the following aggregated figures:
- the number of negative animals (Field name in the tool: Negative~);
- the number of positive animals to the screening test for which the scrapie case type has been completely discriminated (Positive~);
- the number of positive tested animals for which the scrapie case type has not been completely discriminated or is pending for further testing (Inconclusive~);
- the total number of tested animals (Tested~ – automatically calculated by the tool as the sum of Negative~, Positive~ and Inconclusive~);
- the number of unsuitable samples, i.e. samples which were considered not suitable for testing, and for this reason not concurring in defining the total number of tested animals (Unsuitable~).
In order to aggregate the data as such, the reporting countries need to ’group by’ tested animals according to the following fields (see also the context definition): Country, Sampling year, Sampling month, Species, Age class, Target group, First test type, First test, Herd/Flock status.
In the reporting tool, the possible options for species are:
- Sheep (Ovis aries L.)
- Goat (Capra aegragus hircus L., Capra hircus L.)
The husbandry system is always pre-filled in with Farmed. The options for the Herd/Flock status are:
- infected: under restrictions and enhanced surveillance as per Regulation (EU) 999/2001. Cases reported in this category must be reported as non-index cases.
- not infected: not under restrictions and enhanced surveillance as per Regulation (EU) 999/2001. Cases reported in this category must be reported as index cases.
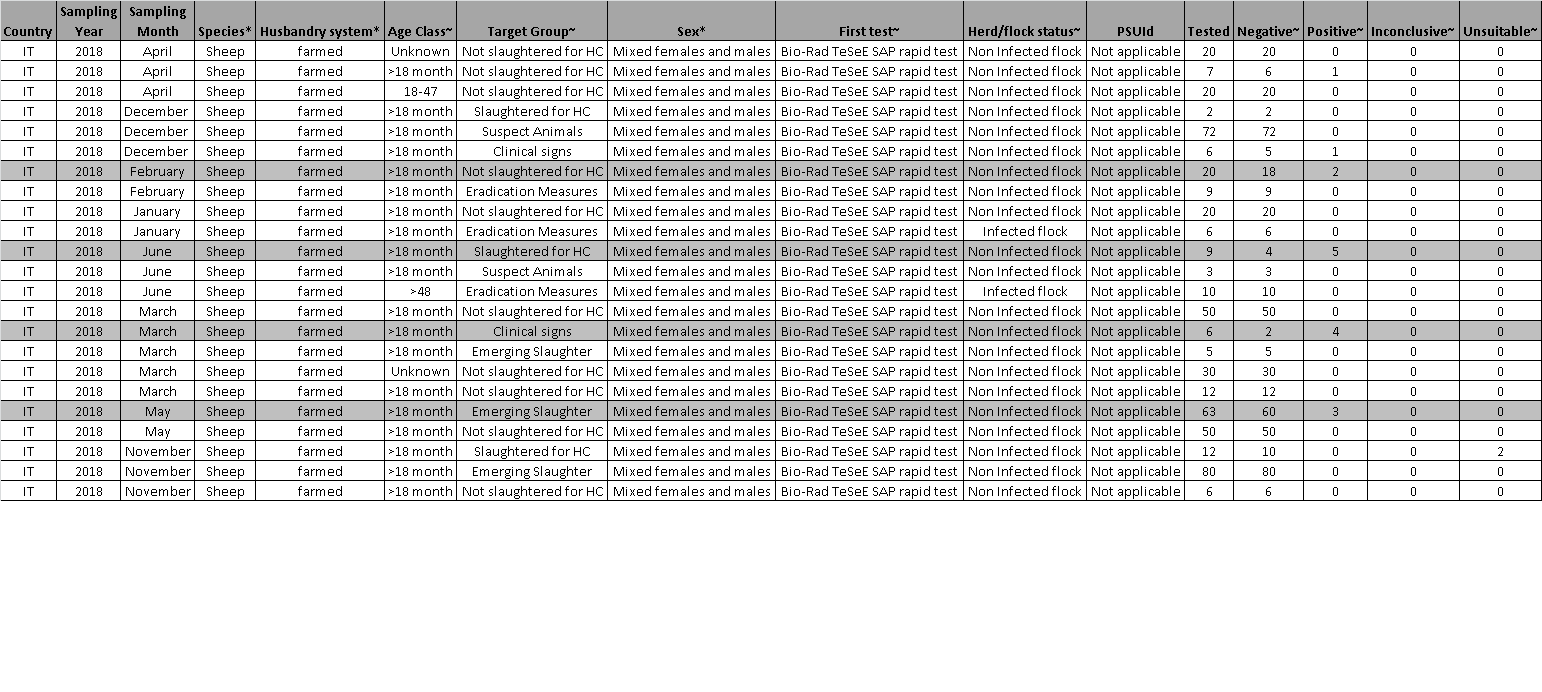
As an example, the output of the query could look like this:

This is an example of a dataset for Italy for the year 2018 prepared for submission of the aggregated data (level 1) for scrapie in sheep in the TSE data reporting tool. The records shaded in grey contain positive animals: in total 14 positive animals detected in February (2), March (4), June (5) and May (3). At least for these animals, additional fields need to be populated in the Sample level data (level 2) and in the Analytical test results (level 3). Having the summary of your raw data as shown above would facilitate the data entry in the aggregated data level for Scrapie.
