An R package for Response Surface Analysis
The stable CRAN version can be installed by:
install.packages("RSA")
Note that on macos, the use of X11 (including tcltk) requires XQuartz to be installed manually since it is no longer part of OS X. Always re-install XQuartz when upgrading your macos to a new major version.
The current development version can be installed by:
install.packages(c("devtools", "lavaan", "plyr", "ggplot2", "lattice", "tkrplot", "RColorBrewer", "rgl", "gridExtra", "aplpack", "fields", "qgraph"))
devtools::install_github("nicebread/RSA")
- An email list for asking questions related to the RSA-package has been created at Google groups: https://groups.google.com/forum/?fromgroups&hl=en#!forum/rsa-in-r
# if not already done:
# install the RSA package
# (only has to be done once)
# install.packages("RSA")

# load the RSA package for
# the active session
library(RSA)

# open the help page
?RSA

## Motive congruency example
# load the built-in data set
data(motcon)

# Compute the RSA and save the result
# into the new variable r1
r1 <- RSA(postVA ~ ePow * iPow, data=motcon)

# Show summary of the RSA
print(r1)

# Compare all models
compare(r1, plot=TRUE)
aictab(r1, plot=TRUE)

# Show all RSA parameters with parametric
# SEs, p values, and CIs
getPar(r1, "coef", model="RR")

# Standard CIs
c1 <- confint(r1, model="RR")
c1

# Get bootstrapped confidence intervals
# (5000 bootstrap replications),
# only from the RR model
c2 <- confint(r1, model="RR", method="boot", R=5000)
c2

# Plot the final model
plot(r1, model="RR",
    xlab="Explicit power motive",
    ylab="Implicit power motive",
    zlab="Affective valence")


## Additional functions
# contour plot
plot(r1, model="RR", type="contour")

# interactive, rotatable 3d plot
plot(r1, model="RR", type="interactive")

# open an interactive widget with control
# sliders for regression weights
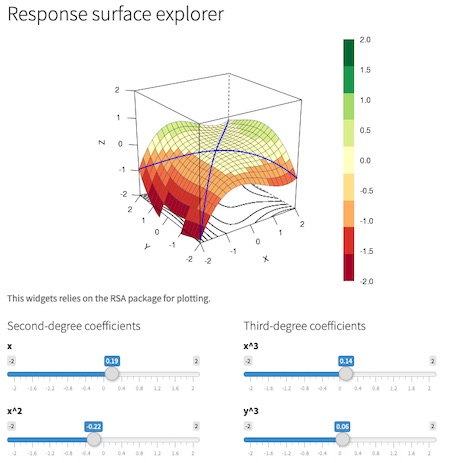
demoRSA()
Not part of this package, but related: you can create polynomial surface plots with this interactive app:


