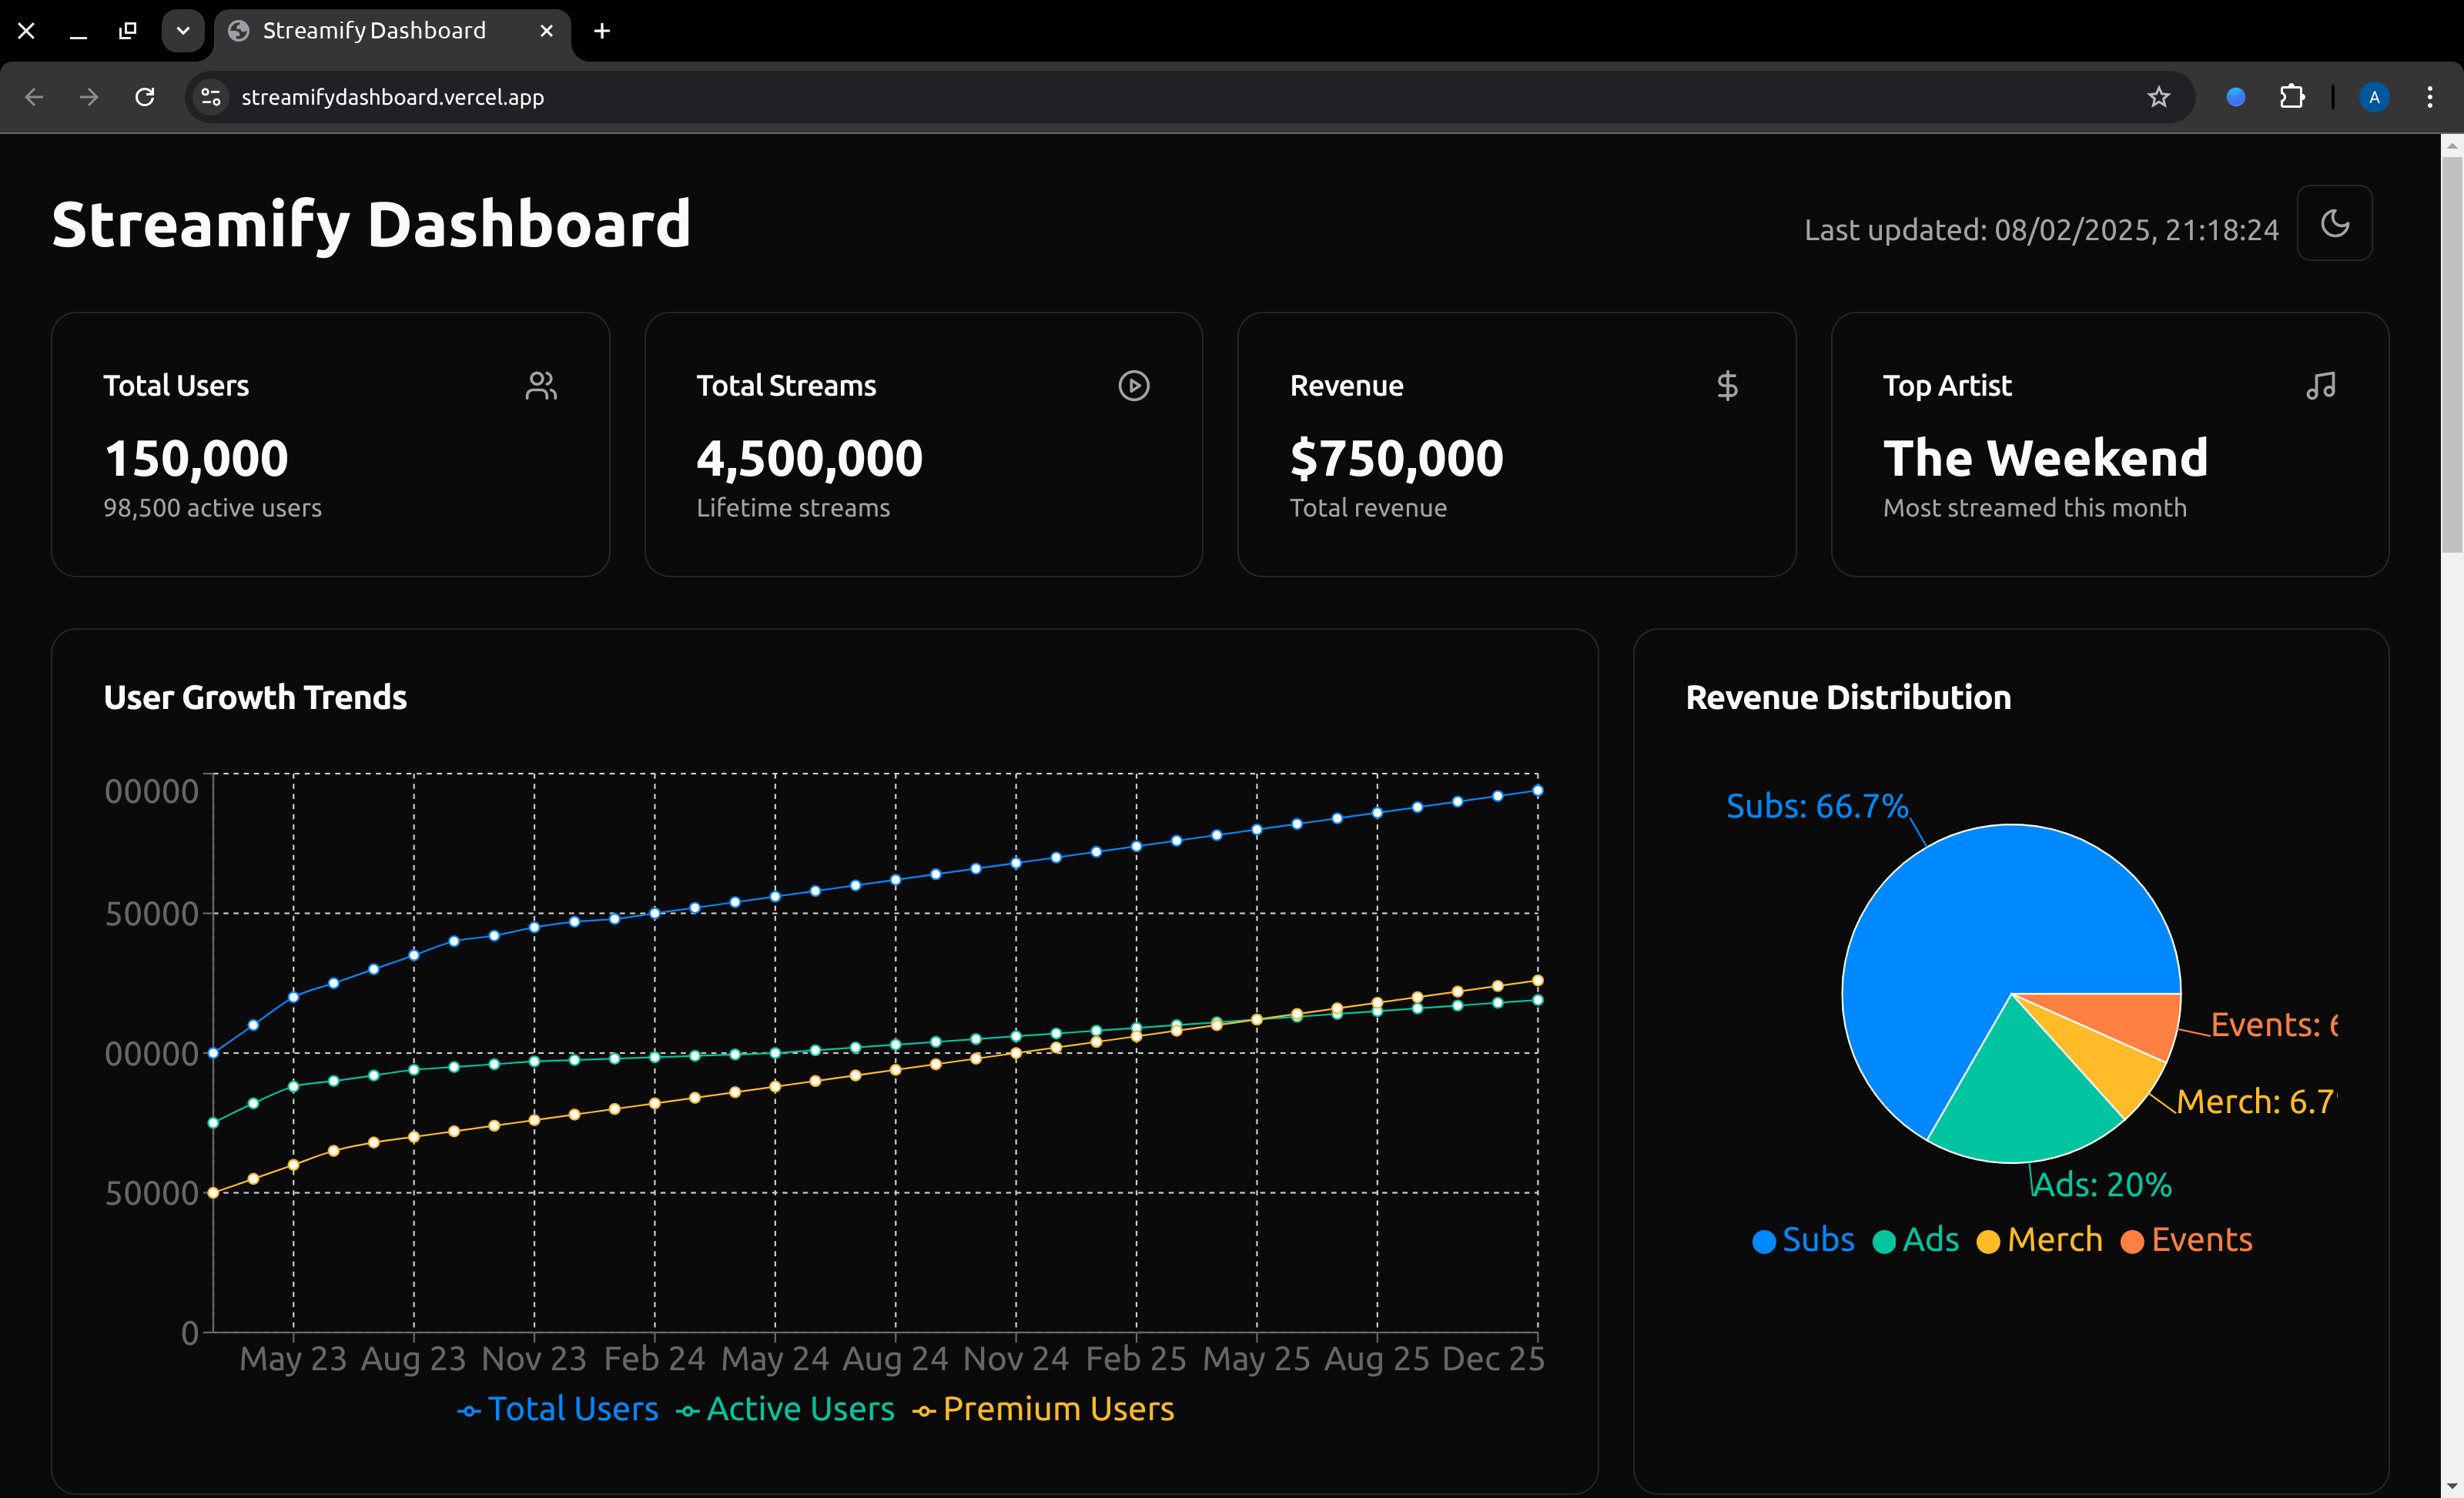
A dashboard with bar charts, pie charts, and a table visually presents data. Bar charts compare categories, pie charts show proportions, and tables provide detailed data. Together, they offer both high-level overviews and in-depth insights for better analysis and decision-making.
- Clone the project
mkdir cd ~/Dev/streamify-dashboard -p
cd ~/Dev/streamify-dashboard
git clone https://github.com/arvind-4/streamify-dashboard.git .- Go to the project directory
cd ~/Dev/streamify-dashboardInstall dependencies
pnpm installStart the server
pnpm devTo run tests, run the following command
pnpm testTo deploy this project run
pnpm buildopen the dist/index.html file in your browser