This project is to visualize the graph network corresponding to a gremlin query.
Below is a quick start guide to start JanusGraph, load the testing graph, and start visualization to show the graph.
Notice, this guide uses Docker compose, but it's possible to start JanusGraph and visualization tool without (see Setting Up JanusGraph Visualizer section below).
- Start the docker services using
docker compose upfor the starting the Janusgraph service, loading the test data and starting the visualization service. - (Optional) If you want to specially build the visualizer from the source code, use
docker compose up --build. - Open your browser and enter address
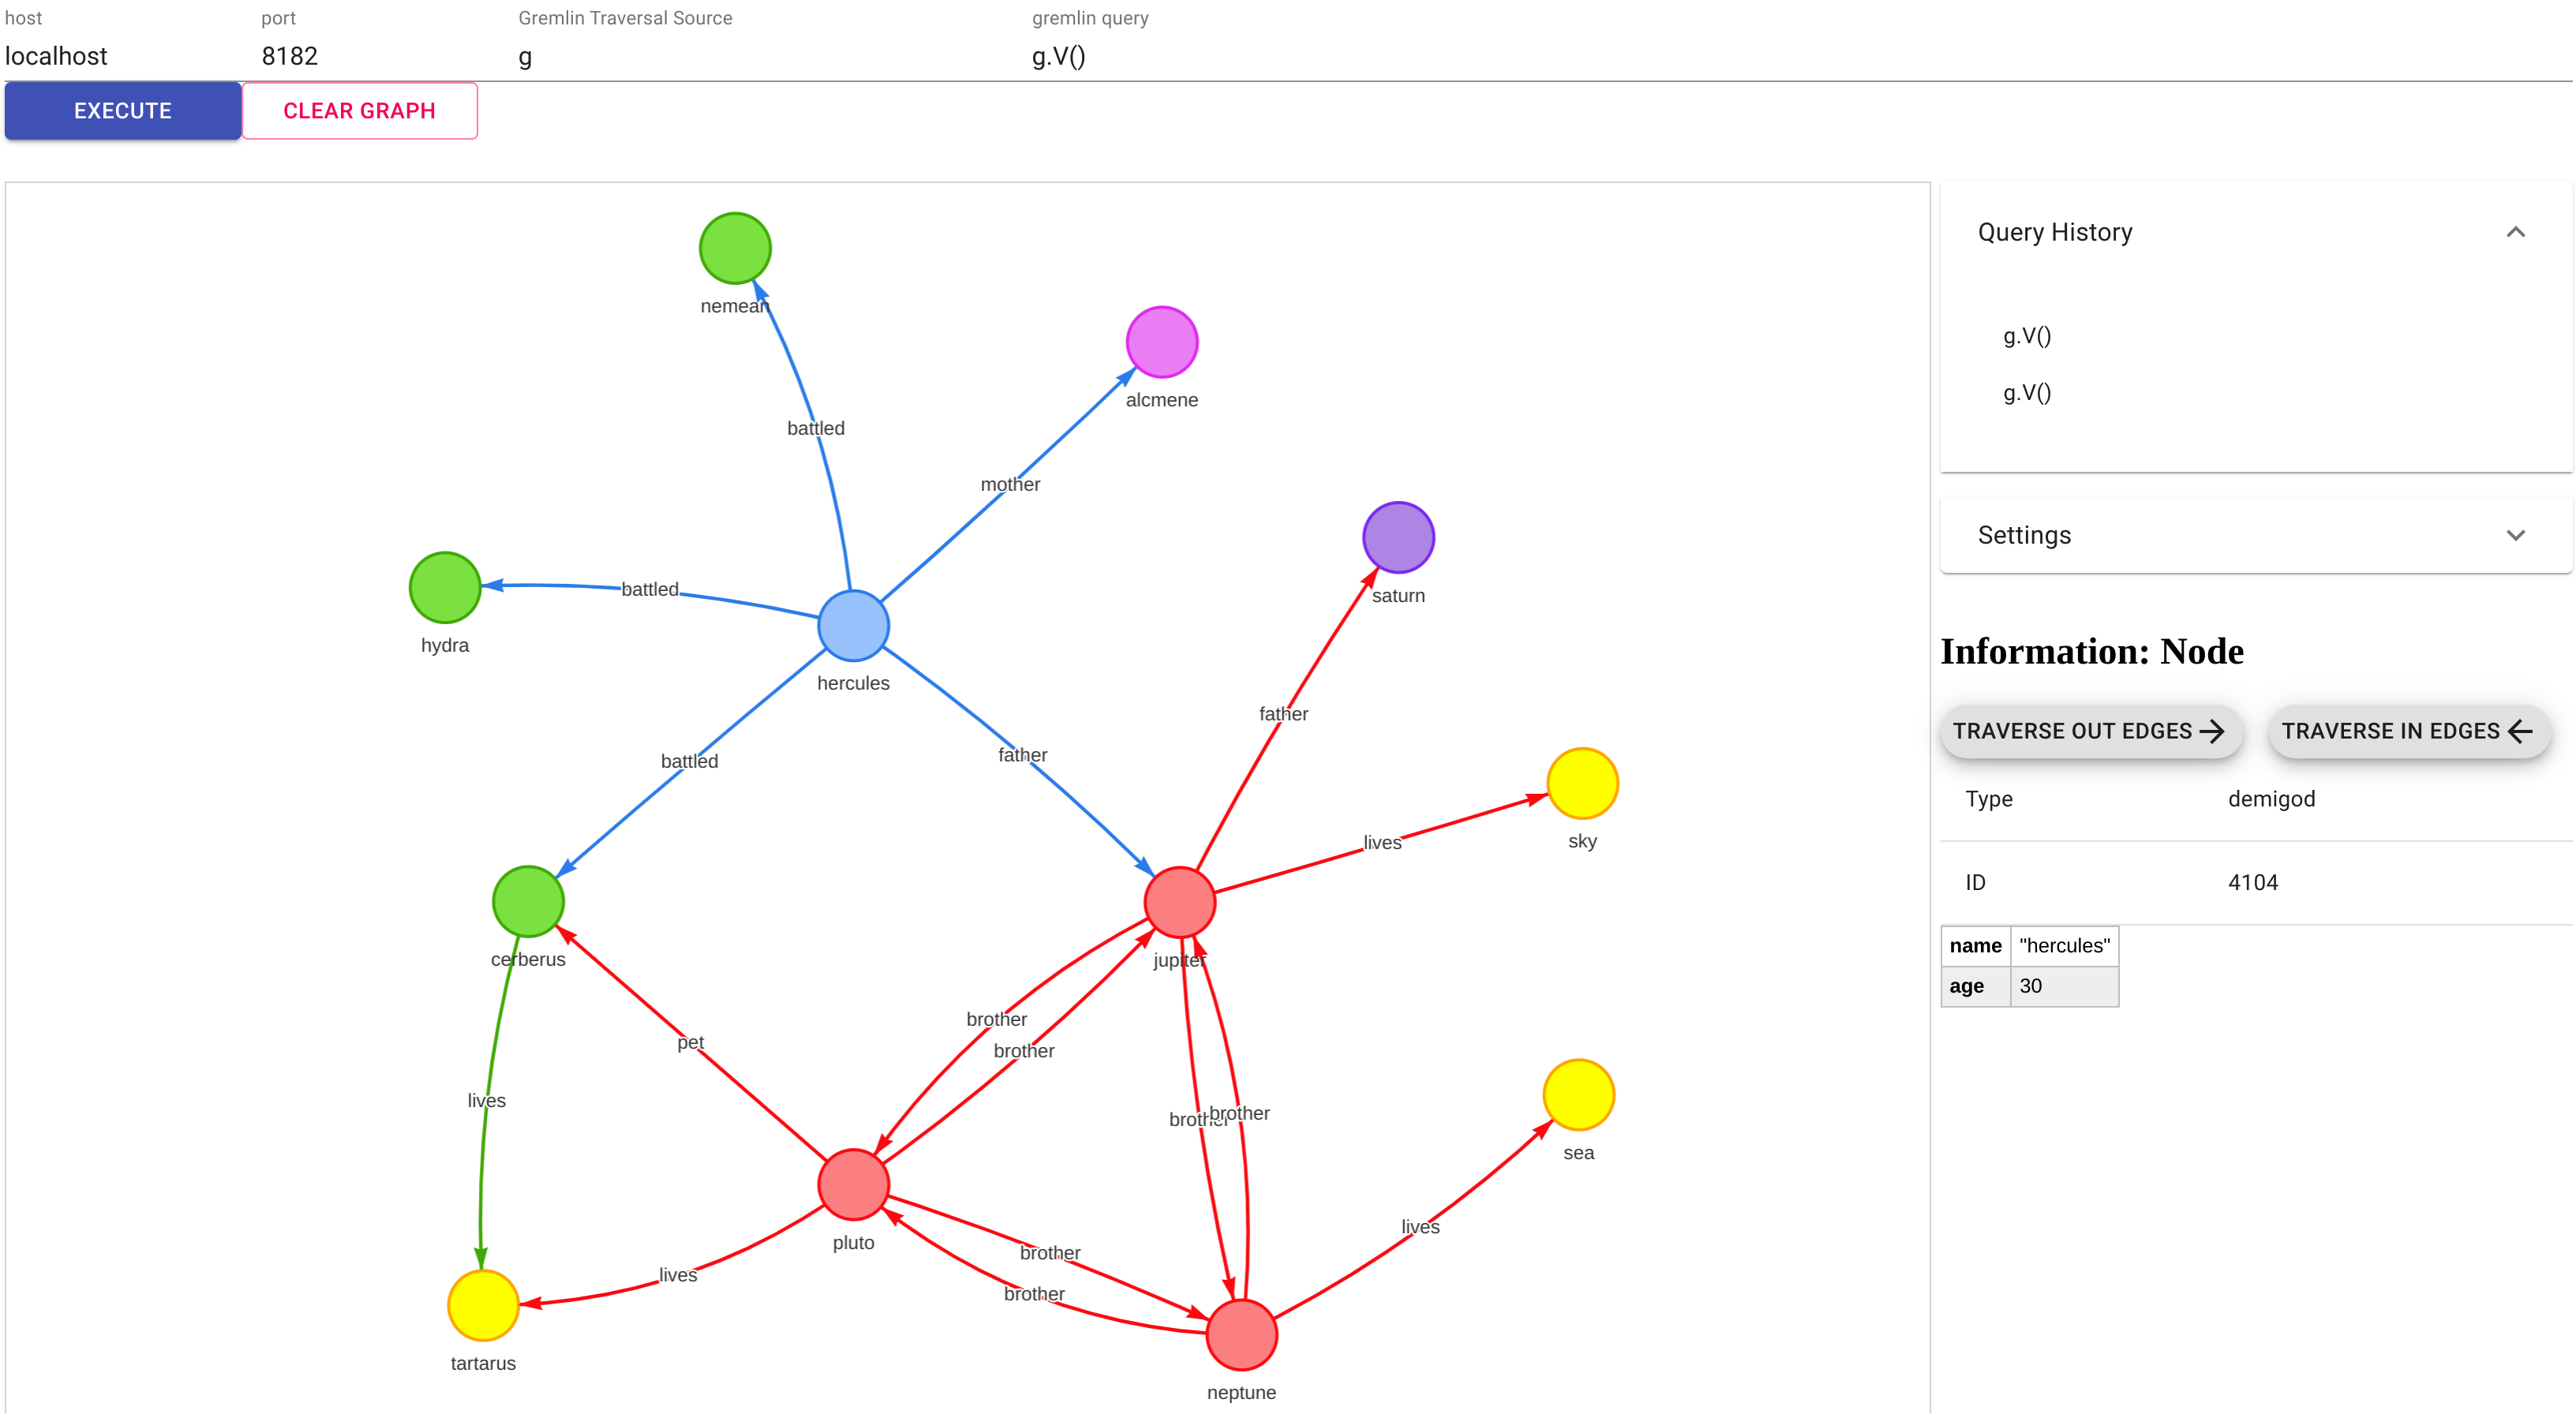
http://localhost:3001/ - Click
EXECUTEbutton. You should see the same graph as the one specified on the image above. - The Docker containers can be stopped by calling
docker compose down.
To setup JanusGraph visualizer, you need to have node.js and npm installed in your system.
- Clone the project
git clone https://github.com/JanusGraph/janusgraph-visualizer.git- Install dependencies
npm install- Run the project
npm start- Open the browser and navigate to
http://localhost:3000Note - Frontend starts on port 3000 and simple Node.js server also starts on port 3001. If you need to change the ports, configure in package.json, proxy-server.js, src/constants
See docs/docker-build.md to learn how to build the project directly using Docker images.
GREMLIN_HOST- sets gremlin server hostname for connection. Default isjanusgraphif started viadocker compose up(docker-compose.ymlreceives this value from.envfile) orlocalhostif started directly viadocker run.GREMLIN_PORT- sets gremlin server port for connection. Default is8182.GREMLIN_TRAVERSAL_SOURCE- sets default graph traversal source name to be used for queries. Default isg.GREMLIN_DEFAULT_QUERY- sets default query to show in visualizer. Default isg.V().
You can change these values in the .env file.
- Start JanusGraph-Visualizer as mentioned above
- Specify the host and port of the gremlin server
- Write a gremlin query to retrieve a set of nodes (eg.
g.V())
- If you don't clear the graph and execute another gremlin query, results of previous query and new query will be merged and be shown.
- Node and edge properties are shown once you click on a node/edge
- Change the labels of nodes to any property
- View the set of queries executed to generate the graph
- Traverse in/out from the selected node
JanusGraph-Visualizer is based on the original Gremlin-Visualizer that can be found here.
Author of the original Gremlin-Visualizer is: Umesh Jayasinghe.
- Added suppport for different graph names
- Added GitHub actions to build & push Docker image
- Added productions mode to host in Kubernetes
- Added ability to override default values (graph host, port, name) via environment variables
If you have new ideas to improve please create an issue and make a pull request