This provides a GBBasemap for use in plotting geographic data for Great
Britain at the county level. We use data from the
UK Data Service to provide Basemap like object
in matplotlib.
I could not find a python module to plot maps of the UK with county level data. If you know of any, please do let me know :D
To install please run
$ python setup.py install
This downloads all the shape-files and places them in ~/.shape_files where
you can also add your own shape-files if you please. The module pymapgb
should now be available to use.
A Minimum working example is provided in the file countries.py, the
basics are as follows:
-
First create a map instance:
import matplotlib.pyplot as plt
from pymapgb import GBBasemap
GBmap = GBBasemap()
-
this provides several methods. The first is
draw_by_request, this automates alot of the work, for example to draw the outline of a country:GBmap.draw_by_request("country", "england", facecolor="w", edgecolor="k")
-
and to add county level data:
GBmap.draw_by_request("counties", "wales", colors='random')
-
However what we want to draw is usually dictated by the data. To this end a low level method is available
draw_by_file_namewhich takes the file-name of a shape-file (in the~/.shape_files/directory) and works directly from that.
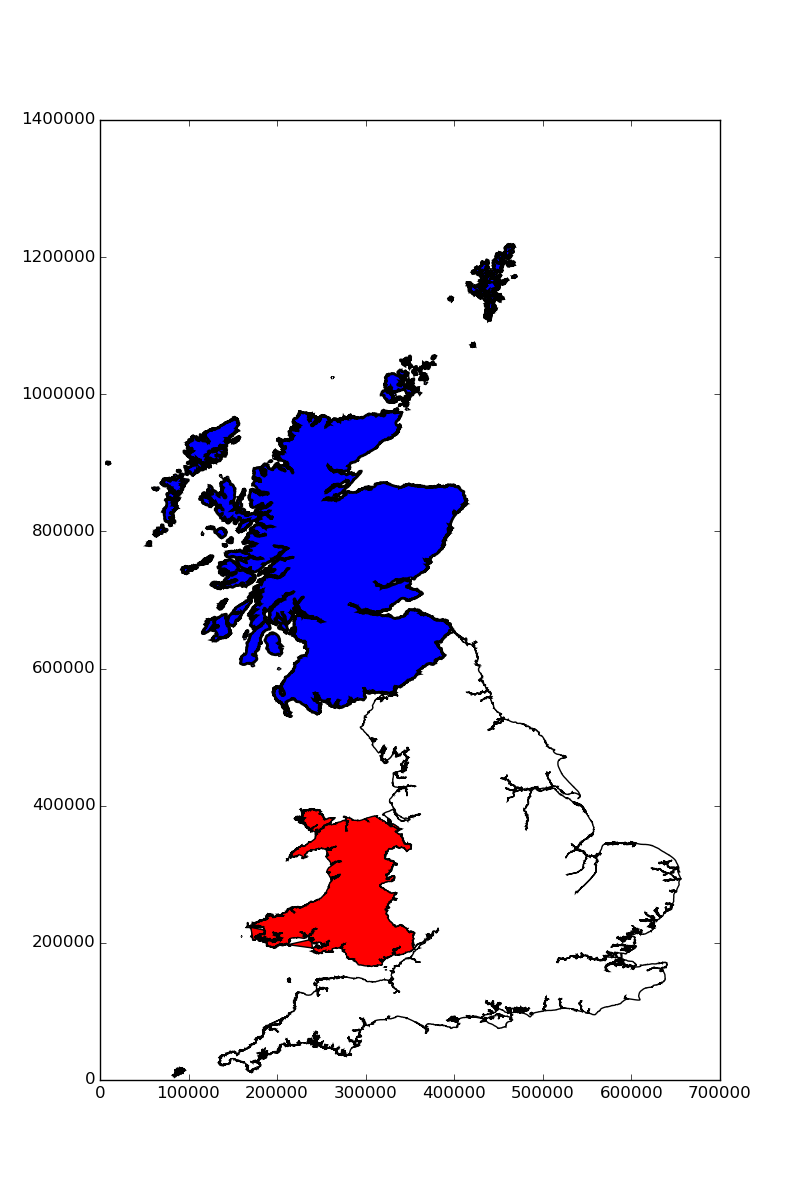 Countries of Great Britain
|
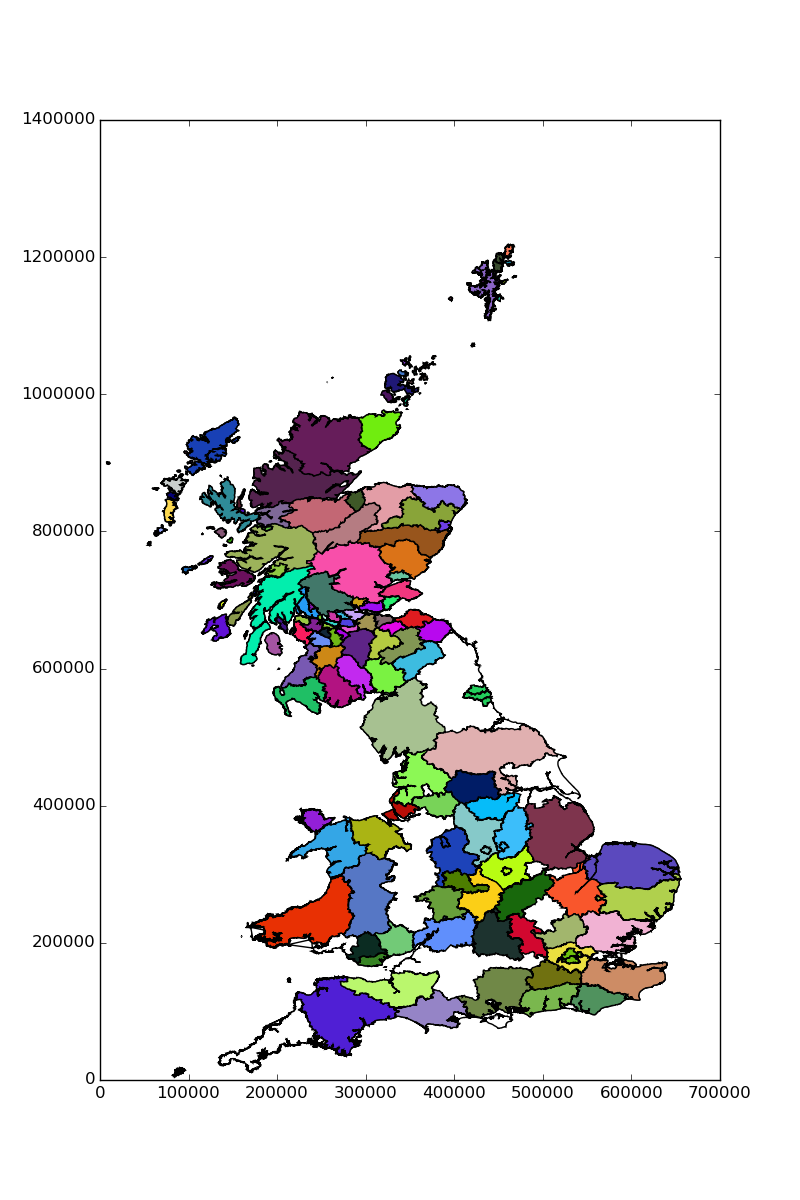 Counties of Great Britain
|
This is in an early development status and requires quite a lot of work before it can be useful generally. I would love it if you want to be involved, feel free to PR anytime with anything you like.
- Fix missing English counties
- Documentation
- Implementation of coloring