Generate execution flow diagram #5924
Replies: 7 comments 11 replies
-
|
@markerikson how much of this would be solved by showing a call tree and user timings? curious what use cases would not be captured... |
Beta Was this translation helpful? Give feedback.
-
|
From @kettanaito in Reactiflux, asking separately without knowing about Replay :
|
Beta Was this translation helpful? Give feedback.
-
|
Some more ideas and feedback, including suggesting using a "flame graph" diagram for navigating the execution of a replay: |
Beta Was this translation helpful? Give feedback.
-
|
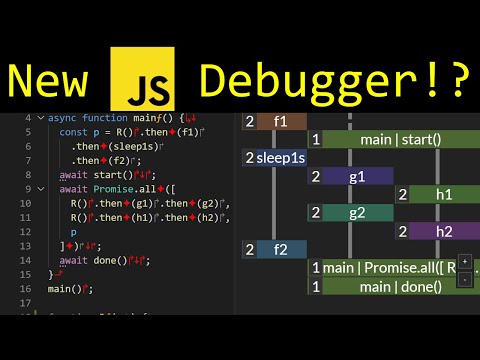
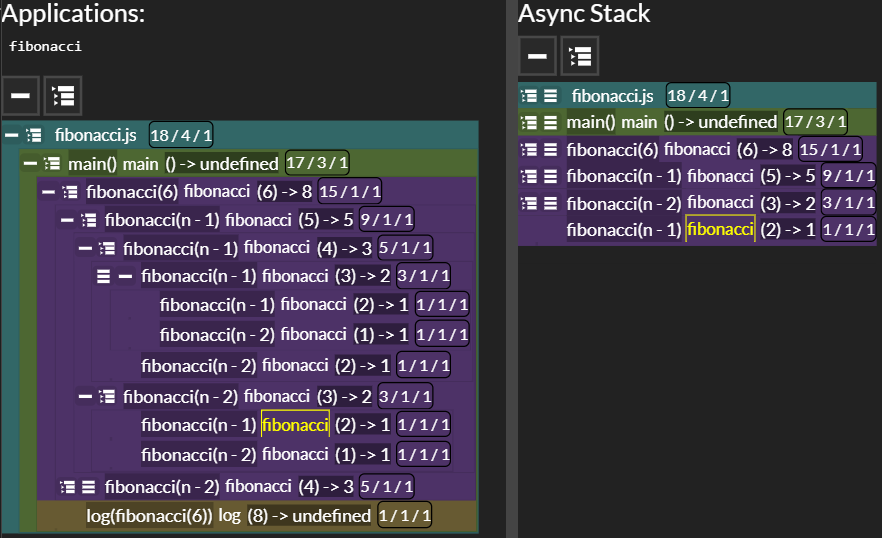
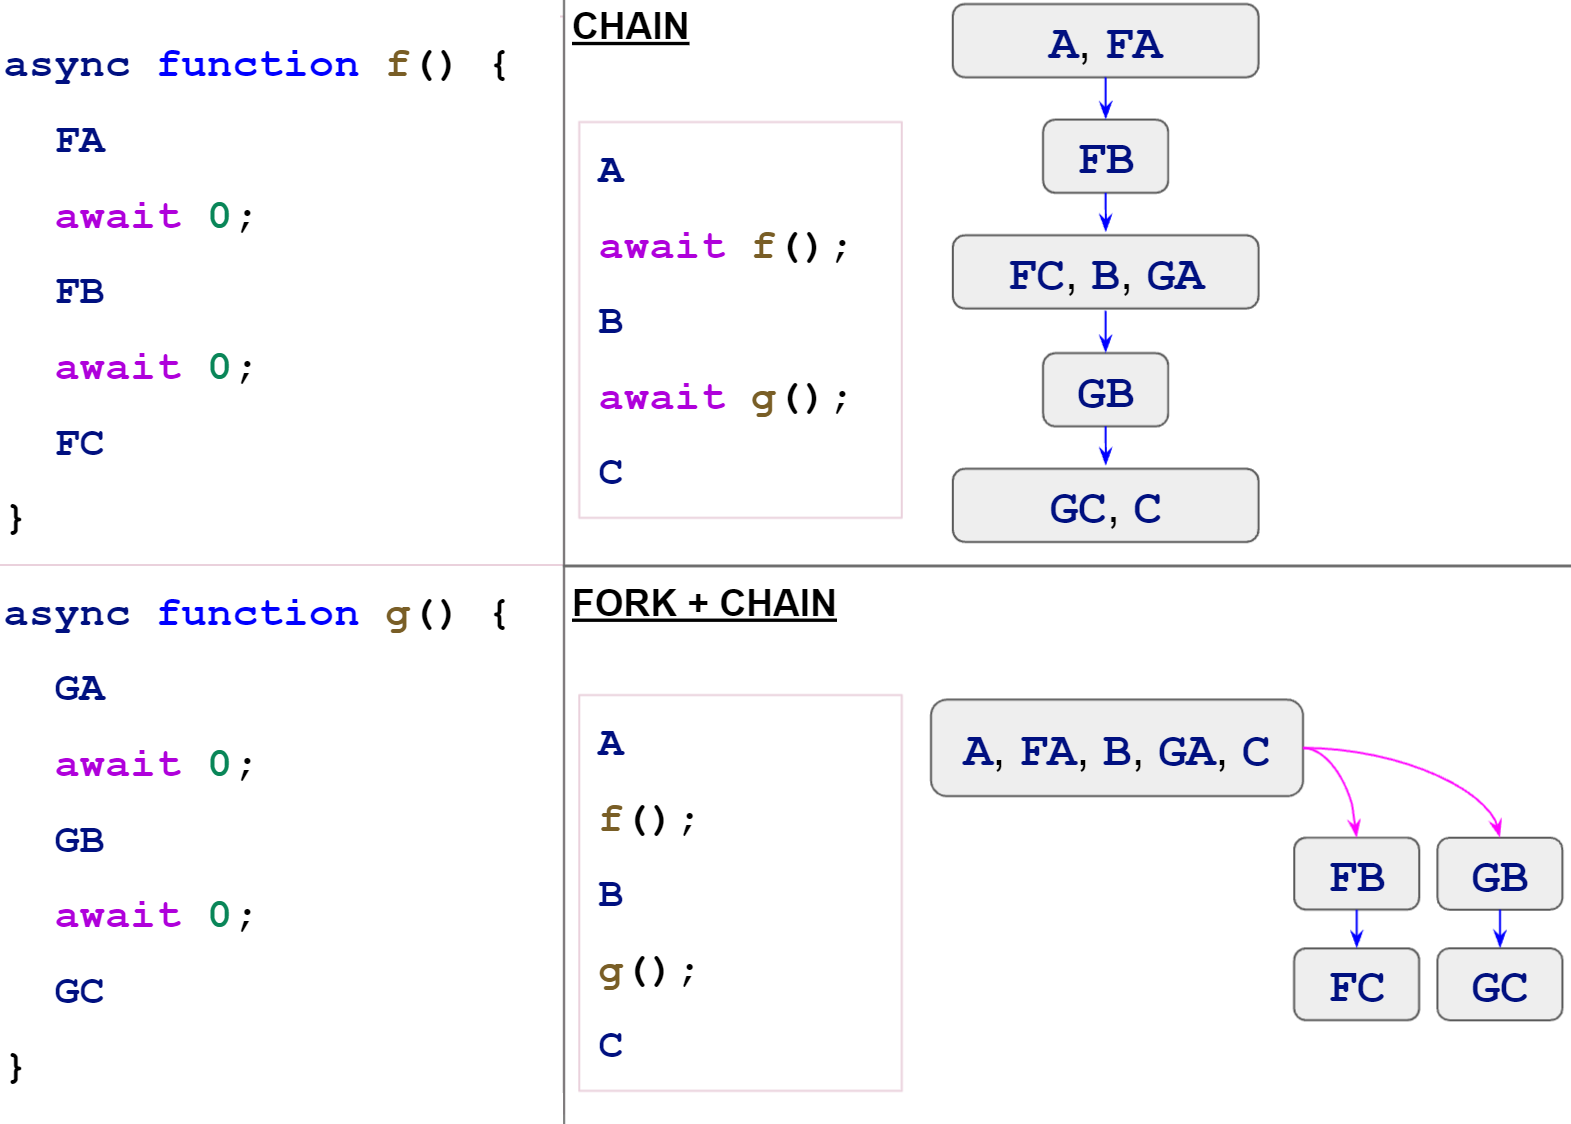
hi, this is Domi, creator of Dbux. Let me quickly introduce Dbux's "maps", i.e. global runtime visualization tools: (But I definitely also recommend checking out the much more complete (and generously timestamped) intro video.)
Some realizations after starting to use these tools
Implementation + Performance notes
Some more pretty pictures and stuffDbux (recent) Intro VideoFibonacci Call Graph vs. Call Stack (w/
|
Beta Was this translation helpful? Give feedback.
-
|
Another set of interesting diagrams: Kolo for Django: |
Beta Was this translation helpful? Give feedback.
-
|
Some more prior art: |
Beta Was this translation helpful? Give feedback.
-
|
Throwing something else in here: This extremely long article on perf profiling the guts of the Rust compiler talks about OpenTelemetry, and how to generate "spans" that can be visualized. Maybe something related we could do? |
Beta Was this translation helpful? Give feedback.


-
We're recording the entire app. Can we generate an execution flow diagram from that info?
I'd love to be able to see, say, a trace of the startup sequence for Replay itself:
Like, give me a way to visualize what files I'm jumping through, including the ability to blackbox things like React so we skip that stuff. Some potential visualizations:
dotvizgraphBeta Was this translation helpful? Give feedback.
All reactions