-
Notifications
You must be signed in to change notification settings - Fork 618
PostAlignment QC

#2-iv. Post-Alignment QC ##Use samtools, samstat, and FastQC to evaluate the alignments
Use samtools view to see the format of a SAM/BAM alignment file
cd $RNA_ALIGN_DIR
samtools view -H UHR.bam
samtools view UHR.bam | head
Try filtering the BAM file to require or exclude certain flags. This can be done with samtools view -f -F options
-f INT required flag -F INT filtering flag
"Samtools flags explained"
Try requiring that alignments are 'paired' and 'mapped in a proper pair' (=3). Also filter out alignments that are 'unmapped', the 'mate is unmapped', and 'not primary alignment' (=268)
samtools view -f 3 -F 268 UHR.bam | head
Now require that the alignments be only for 'PCR or optical duplicate'. How many reads meet this criteria? Why?
samtools view -f 1024 UHR.bam | head
Use samtools flagstat to get a basic summary of an alignment. What percent of reads are mapped? Is this realistic? Why?
cd $RNA_ALIGN_DIR
samtools flagstat UHR.bam
samtools flagstat HBR.bam
Details of the SAM/BAM format can be found here: http://samtools.sourceforge.net/SAM1.pdf
##Using FastQC
You can use FastQC to perform basic QC of your BAM file (See Pre-Alignment QC). This will give you output very similar to when you ran FastQC on your fastq files.
Background: RSeQC is a tool that can be used to generate QC reports for RNA-seq. For more information, please check: RSeQC Tool Homepage
Objectives: In this section, we will try to generate a QC report for a data set downloaded from RSeQC website.
Files needed:
- Aligned bam file.
- Index file for the aligned bam.
- A RefSeq bed file.
Set your working directory and copy the necessary files
cd $RNA_HOME
cp -r ~/workspace/data/rnaseq-tutorial/RSeQC.zip .
Unzip the RSeQC file:
unzip RSeQC.zip
cd RSeQC/
Note: You should now see the bam, index, and RefSeq bed files listed. The bam file here is an pair-end non-strand specific example dataset from the RSeQC website.
Run RSeQC commands:
bam_stat.py -i Pairend_nonStrandSpecific_36mer_Human_hg19.bam
clipping_profile.py -i Pairend_nonStrandSpecific_36mer_Human_hg19.bam -o tutorial -s "PE"
geneBody_coverage.py -r hg19_UCSC_knownGene.bed -i Pairend_nonStrandSpecific_36mer_Human_hg19.bam -o tutorial
infer_experiment.py -r hg19_UCSC_knownGene.bed -i Pairend_nonStrandSpecific_36mer_Human_hg19.bam
inner_distance.py -r hg19_UCSC_knownGene.bed -i Pairend_nonStrandSpecific_36mer_Human_hg19.bam -o tutorial
junction_annotation.py -r hg19_UCSC_knownGene.bed -i Pairend_nonStrandSpecific_36mer_Human_hg19.bam -o tutorial
junction_saturation.py -r hg19_UCSC_knownGene.bed -i Pairend_nonStrandSpecific_36mer_Human_hg19.bam -o tutorial
read_distribution.py -r hg19_UCSC_knownGene.bed -i Pairend_nonStrandSpecific_36mer_Human_hg19.bam
read_duplication.py -i Pairend_nonStrandSpecific_36mer_Human_hg19.bam -o tutorial
read_GC.py -i Pairend_nonStrandSpecific_36mer_Human_hg19.bam -o tutorial
read_NVC.py -i Pairend_nonStrandSpecific_36mer_Human_hg19.bam -o tutorial
read_quality.py -i Pairend_nonStrandSpecific_36mer_Human_hg19.bam -o tutorial
ls *.pdf
Go through the generated PDFs by browsing through the following directory in a web browser:
* http://__YOUR_IP_ADDRESS__/workspace/rnaseq/RSeQC/
-------
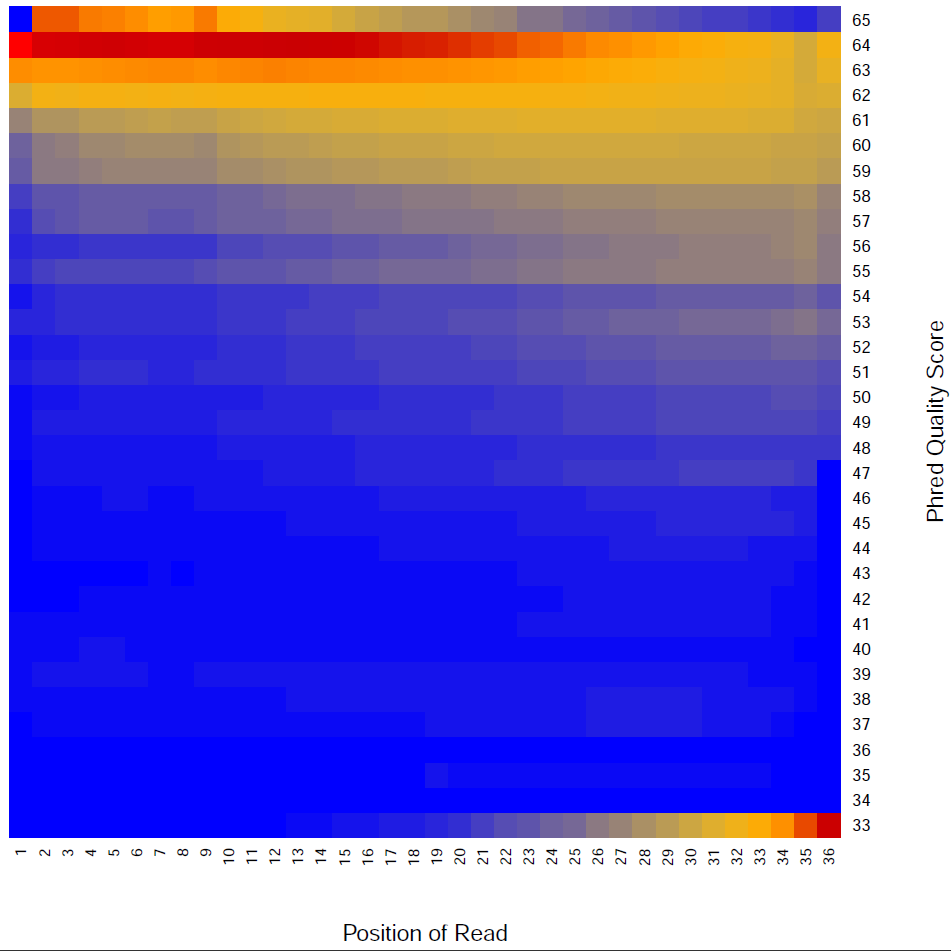
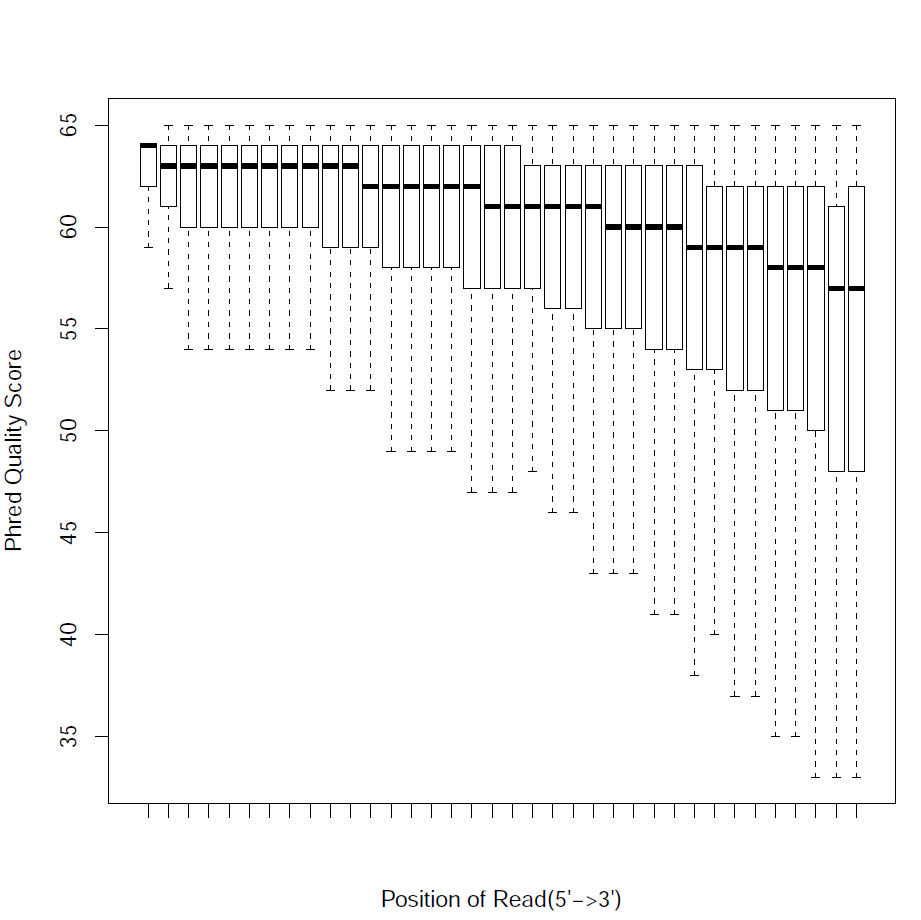
**Read Quality:**
-------
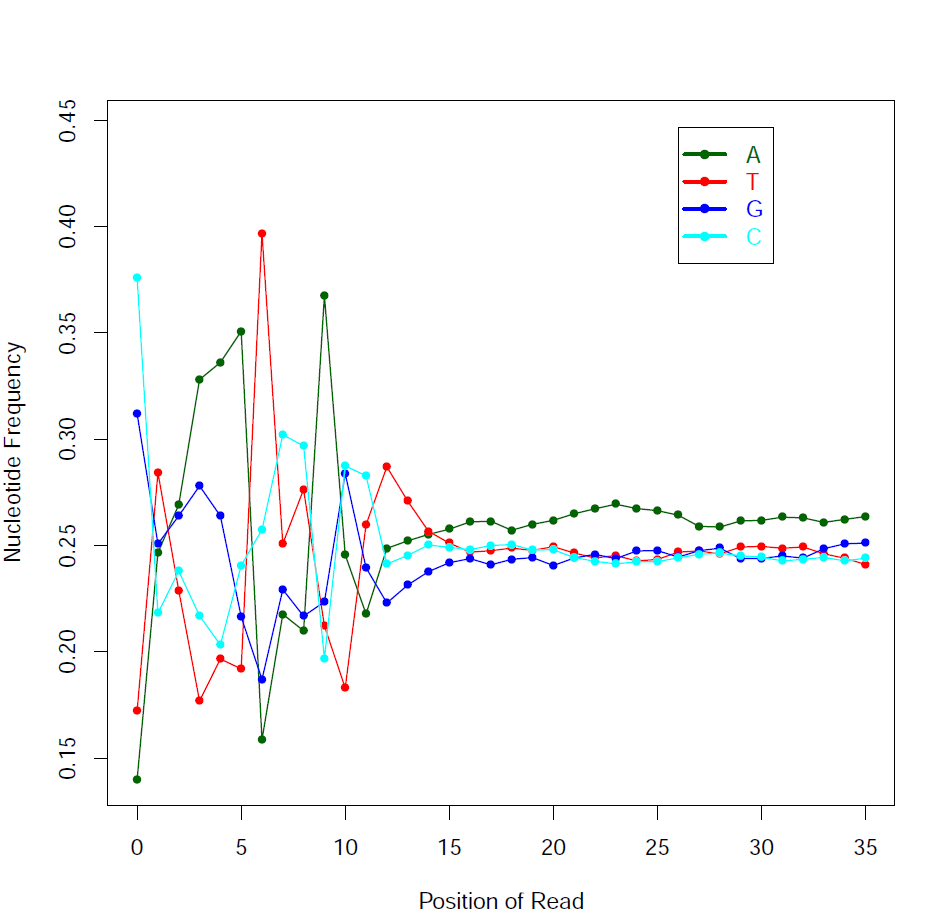
**Read - Nucleotide vs Cycle (Phred base score vs. position in read):**
The pattern we see here at the beginning of the reads may be caused by biases caused by random hexamer priming that arose when making cDNA from RNA (http://www.ncbi.nlm.nih.gov/pmc/articles/PMC2896536/ for further discussion).
-------
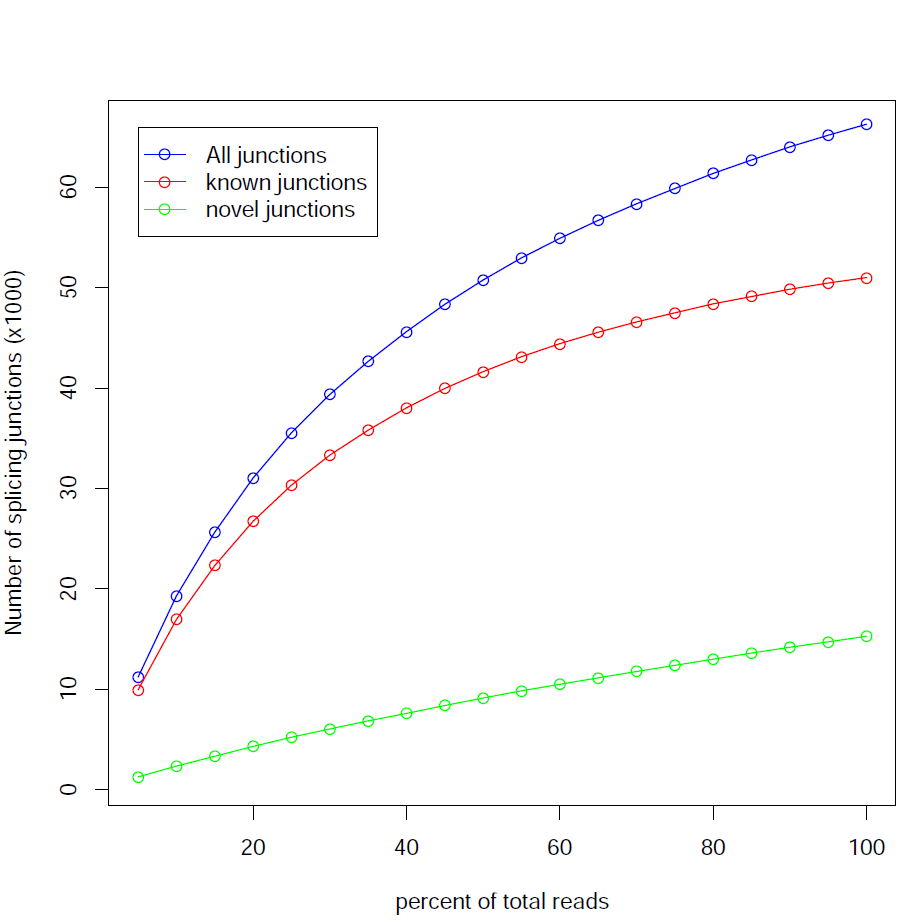
**Junction Saturation:**
This module checks for saturation of junction discovery by resampling 5%, 10%, 15%, ..., 95% of total alignments from the BAM or SAM file. The number of junctions discovered at each level of downsampling is plotted. If we are exhausting the junction information in our library, the line will plateau as the amount of data increases.
-------
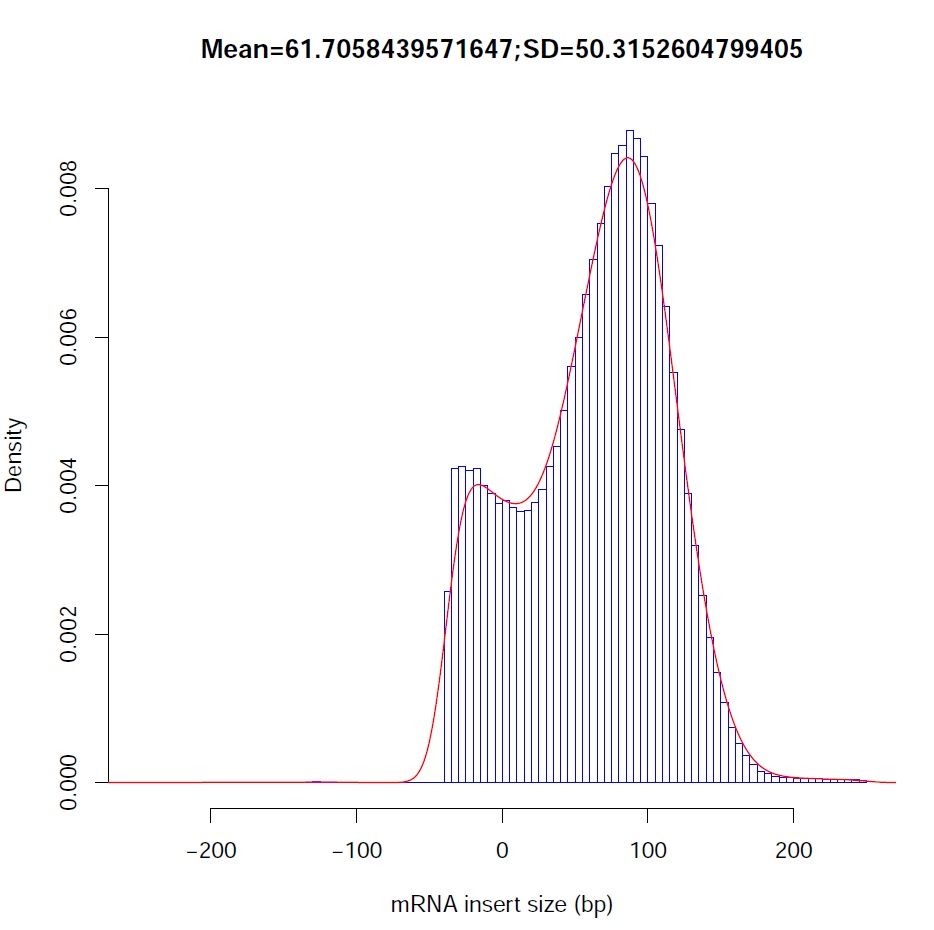
**Distribution of observed inner distances in fragments:**
-------
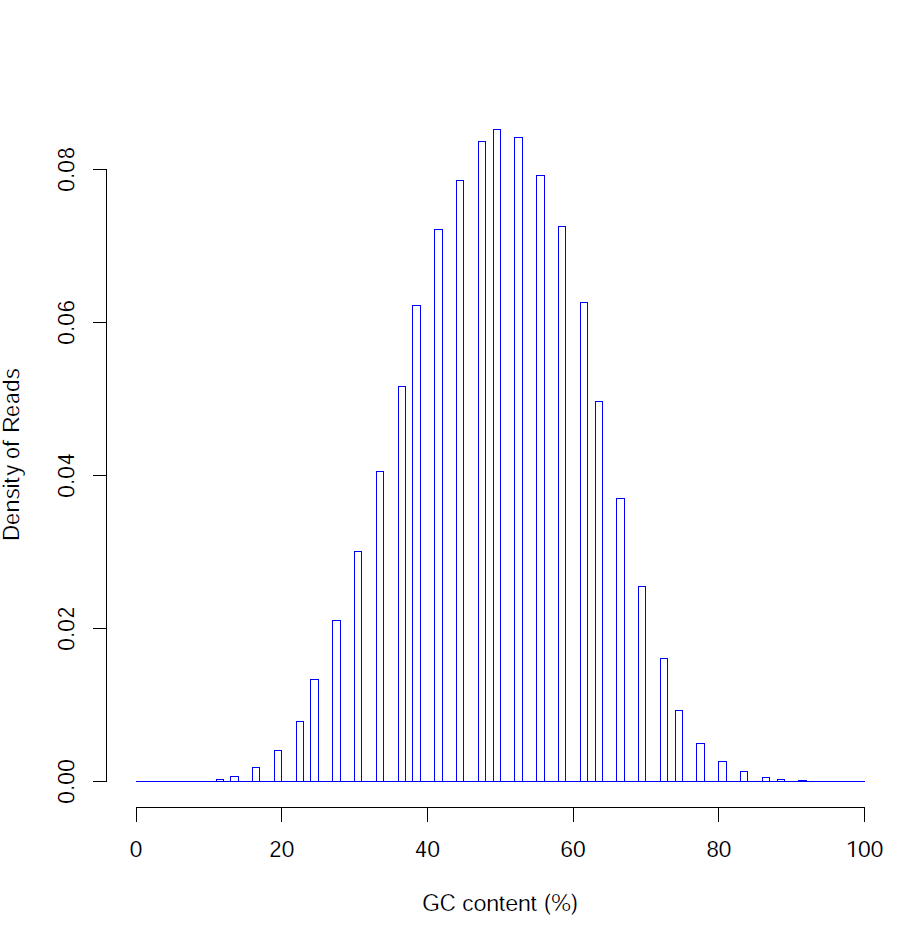
**Distribution of read GC content (%):**
| [[Previous Section|PostAlignment-Visualization]] | [[This Section|PostAlignment-QC]] | [[Next Section|Expression]] |
|:-------------------------------------------------------:|:---------------------------------:|:---------------------------------------------:|
| [[Alignment Visualization|PostAlignment-Visualization]] | [[Alignment QC|PostAlignment-QC]] | [[Expression|Expression]] |
NOTICE: This resource has been moved to rnabio.org. The version here will be maintained for legacy use only. All future development and maintenance will occur only at rnabio.org. Please proceed to rnabio.org for the current version of this course.
Table of Contents
Module 0: Authors | Citation | Syntax | Intro to AWS | Log into AWS | Unix | Environment | Resources
Module 1: Installation | Reference Genomes | Annotations | Indexing | Data | Data QC
Module 2: Adapter Trim | Alignment | IGV | Alignment Visualization | Alignment QC
Module 3: Expression | Differential Expression | DE Visualization
Module 4: Alignment Free - Kallisto
Module 5: Ref Guided | De novo | Merging | Differential Splicing | Splicing Visualization
Module 6: Trinity
Module 7: Trinotate
Appendix: Saving Results | Abbreviations | Lectures | Practical Exercise Solutions | Integrated Assignment | Proposed Improvements | AWS Setup