In this project, we aims to predict hourly electricity demand, based on previous electricity demand and current weather factors. This project will attempt to determine which weather factors significantly contribute to electricity demand, and whether the same forecasting techniques can be used to accurately predict electricity demand in different building types. Specifically, we will try to relate weather in New York City and electricity demands of four buildings of different types in the city.
On a large scale, predicting electricity demand is important for electrical distribution grids worldwide to handle the needs of their consumers. Businesses need to be able to budget for their own electrical use. Traditionally, forecast of electricity demand has been based on seasonality and day/night shift. This forecast model is premature and inaccurate in many cases. Understanding how weather factors contribute to electricity demand will render a more precise model and facilitate the optimal allocation of resources. Forecasting energy demand can also identify when buildings are operating inconsistently, or using excessive amounts of energy.
The dataset involves a linear relationship between weather factors and electricity demand. For example, as average humidity and temperature increase, we can expect that electricity demand will increase. The accuracy of the machine learning implementation will be relatively simple to evaluate, as it is a supervised learning problem with continuous output. The robustness of the model will also be tested, as it could be implemented across four different datasets, which include two different building types.
To avhieve our goal, we will use data from two time series datasets. The first dataset is weather data collected at Central Park station in NYC, provided by National Center for Environmental Information. Central Parks is located near the grographical center of Manhattan Island and we believe weather at that station is representative of weather of the whole city. The weather dataset contains the following features which we believe are closely related to electricity demand: Dew Point Temperature (dewtemp), Dry Bulb Temperature (drytemp), Humidity (humidity), Precipitation (precip) and Wind Speed (wind speed). The second dataset is provided by Grace Mitchell, one of our team members. It contains time series electricity demands of a courthouse, an office building and two school buildings in the city. These are actually four datasets, as we will train four different models on each type of building. Each time series contains one-year data ranging from 7/1/2016 to 6/30/2017, and we will have all of them to have a uniform time interval of an hour. This is to ensure that time series from two datasets match each other and that they can be safely concatenated. We will build preliminary models on these datasets. If the variance turns out to be too high, we may reduce time interval to 15 or to 5 miniutes, as more data will help reduce variance. We deleted all time information from the dataset, while time in a day still remains as a feature. Thus, we will avoid working with time series. Potentially, we will add time in a day, season and weekday/weekend as features, as electricity demand depends a lot on these time factors. Date will never be considered.
All data from December 8th and 9th was omitted due to the big amount of missing values in weather data. Another problem we encountered when cleaning up the data was that weather data was collected more frequently than one hour and was not “on the hour” for every day. The number of data points collected was inconsistent for each day, as the weather data was not always collected at the same time, or the same number of times every day. As a workaround, we decided to use data points collected that were nearest to “on the hour” (i.e. 12:51, 1:51, … 11:51) for each day. We think this problem will not cause a big affect on prediction accuracy because generally weather does not change in a a few minutes. Because of inconsistent time interval, a total of 12 data points were missing in the weather data, so 12 additional points were randomly duplicated. For each missing weather data point, the values were interpolated between previous and successive moments in time. Generally, many data points for precipitation and wind speed were missing, but this only occurred in approximately ¼ of the data set.
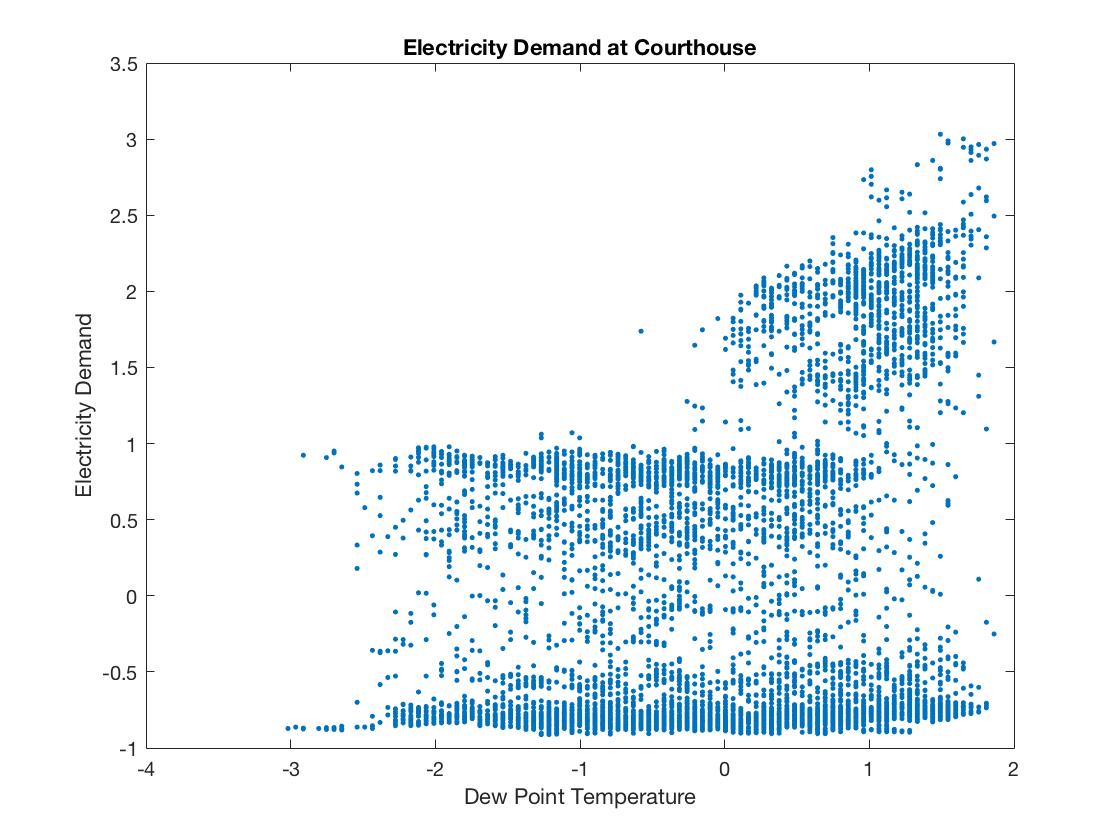
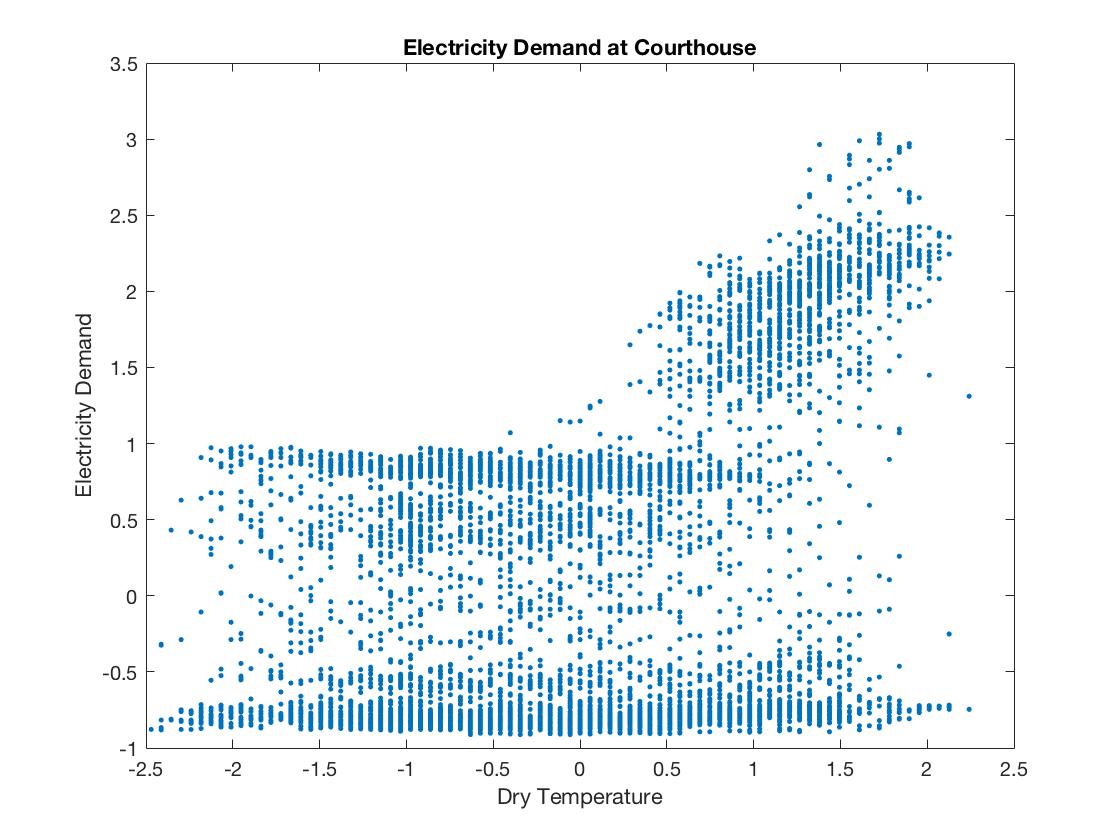
At first look, we can see that some features have a stronger linear relationship with electricity demand than other features, which correspond with our common sense. Here are a few examples:
Basically, new point temperature represent humidity and dry temperature represent the "temperature" that we talk about in the daily life. We anticipate that temperature and humidity are the most important factors influencing eletricity demand. In the scatter graphs below, we can see that as temperature and humidity increase, electricity demand indeed tends to increase.
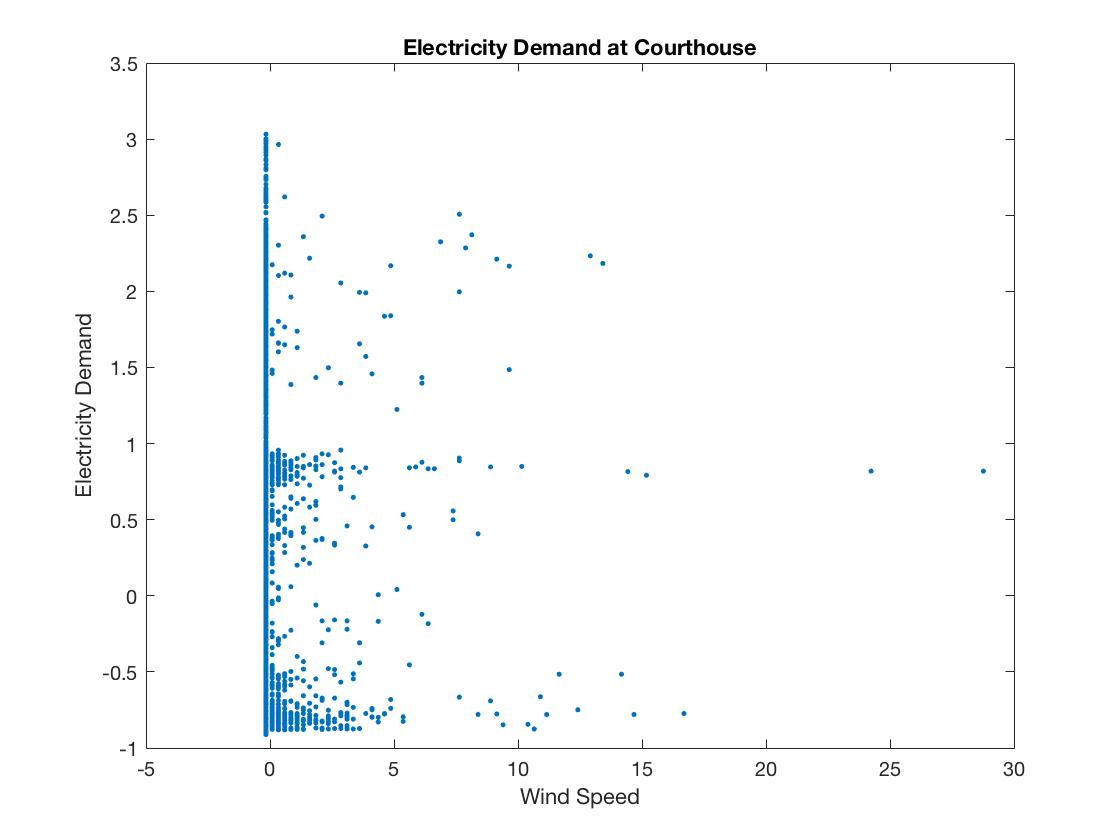
To the contrary, we do not think wind speed is strongly related to electricity demand. The scatter polt below does not show a linear relationship between them, either. In fact, because for the most time wind speed is close to 0, it is not very meaningful to study the relationship between wind speed and electricity demand based on the data we have.
All features vectors were standardized by subtracting column mean and dividing them by column standard deviation. The output sets (electricity demands) were standardized in the same way. Then, data was randomly divided into two sets, with 80% of it put into the training set and 20% put into the test set.
We then trianed a preliminary model for each type of building. During the process, we found out that Dew Point Temperature and Relative Humidity are linearly dependent (and theoretically they should be), so we had to drop me. After testing, we saw that Dew Point Temperature is more predictive, so Relative Humidity will be dropped.
x_1 = dewtemp, x_2 = drytemp, x_3 = precip, x_4 = wind_speed, x_5 = offset(1)
The models are:
w_courthourse = [ -0.385981; 0.725286; 0.0630616; 0.054005; -0.0228609]
training set error = 0.813916, test set error = 0.845572
w_office = [-0.319275; 0.944108; 0.044558; 0.0704494; 0.0143133], average square error = 0.845572
training set error = 0.581667, test set error = 0.578047
w_school1 = [-0.212904; 0.699976; 0.055701; 0.0871717; -0.0248634]
training set error = 0.669492, test set error = 0.713246
w_school2 = [-0.184379; 0.604795; 0.0309144; 0.0843887; -0.0327653]
training set error = 0.746071, test set error = 0.803748
The models generally perform well. However, we must notice that, although errors look small, they are actually not that small because electricity demands are mostly in the interval of [-1, 3]. We believe the models have potentials to be improved. The preliminary models of the four types of buidings are quite different from each other, so for now we think it is necessary to have one model for each type of building.
In the weeks to come, we will try various techniques taught in class, including regularization, to improve the model. We will also add/drop features as we see appropriate. For now, we have four models, one for each type of building. As we improve the models, we will see if they become similar, or very diffierent. If they are similar, we will make one model to predict electricity demand in all buildings.