-
Notifications
You must be signed in to change notification settings - Fork 0
/
Copy pathlesson5_slides.qmd
435 lines (295 loc) · 8.82 KB
/
lesson5_slides.qmd
1
2
3
4
5
6
7
8
9
10
11
12
13
14
15
16
17
18
19
20
21
22
23
24
25
26
27
28
29
30
31
32
33
34
35
36
37
38
39
40
41
42
43
44
45
46
47
48
49
50
51
52
53
54
55
56
57
58
59
60
61
62
63
64
65
66
67
68
69
70
71
72
73
74
75
76
77
78
79
80
81
82
83
84
85
86
87
88
89
90
91
92
93
94
95
96
97
98
99
100
101
102
103
104
105
106
107
108
109
110
111
112
113
114
115
116
117
118
119
120
121
122
123
124
125
126
127
128
129
130
131
132
133
134
135
136
137
138
139
140
141
142
143
144
145
146
147
148
149
150
151
152
153
154
155
156
157
158
159
160
161
162
163
164
165
166
167
168
169
170
171
172
173
174
175
176
177
178
179
180
181
182
183
184
185
186
187
188
189
190
191
192
193
194
195
196
197
198
199
200
201
202
203
204
205
206
207
208
209
210
211
212
213
214
215
216
217
218
219
220
221
222
223
224
225
226
227
228
229
230
231
232
233
234
235
236
237
238
239
240
241
242
243
244
245
246
247
248
249
250
251
252
253
254
255
256
257
258
259
260
261
262
263
264
265
266
267
268
269
270
271
272
273
274
275
276
277
278
279
280
281
282
283
284
285
286
287
288
289
290
291
292
293
294
295
296
297
298
299
300
301
302
303
304
305
306
307
308
309
310
311
312
313
314
315
316
317
318
319
320
321
322
323
324
325
326
327
328
329
330
331
332
333
334
335
336
337
338
339
340
341
342
343
344
345
346
347
348
349
350
351
352
353
354
355
356
357
358
359
360
361
362
363
364
365
366
367
368
369
370
371
372
373
374
375
376
377
378
379
380
381
382
383
384
385
386
387
388
389
390
391
392
393
394
395
396
397
398
399
400
401
402
403
404
405
406
407
408
409
410
411
412
413
414
415
416
417
418
419
420
421
422
423
424
425
426
427
428
429
430
431
432
433
434
435
---
title: "W5: Iterating tasks"
format:
live-revealjs:
df-print: paged
smaller: true
scrollable: true
echo: true
embed-resources: true
footer: <https://bit.ly/intr_wk5>
drop:
engine: webr
button: true
webr:
render-df: paged-table
resources: data/tumor/
output-location: fragment
---
{{< include ./_extensions/r-wasm/live/_knitr.qmd >}}
```{webr}
#| message: false
#| echo: false
#| warning: false
#| edit: false
#| context: setup
library(tidyverse)
library(palmerpenguins)
file_list <- list.files("data/tumor", full.names = TRUE)
plot_recurrence <- function(df){
ggplot(df) +
aes(x=days_to_last_follow_up,
y=age_at_diagnosis) +
geom_point()
}
my_vector = c(1, 3, 5, 7)
result = map(my_vector, log)
species_to_analyze = c("Adelie", "Chinstrap", "Gentoo")
analyze_bill <- function(species_to_analyze){
penguins_subset = filter(penguins, species == species_to_analyze)
out <- mean(penguins_subset$bill_length_mm, na.rm = TRUE)
return(out)
}
```
```{r}
#| echo: false
library(tidyverse)
library(palmerpenguins)
plot_recurrence <- function(df){
ggplot(df) +
aes(x=days_to_last_follow_up,
y=age_at_diagnosis) +
geom_point()
}
my_vector = c(1, 3, 5, 7)
result = map(my_vector, log)
```
# Questions / Review
`r countdown::countdown(minutes=20)`
# Remember to hit Record in Teams
## Iterating tasks
Suppose that you want to repeat a chunk of code many times, but changing one variable's value each time you do it: This could be modifying each element of a vector in the same way, or analyzing a dataframe multiple times with different parameters.
## Iterating tasks: solutions
1. Copy and paste the code chunk, and change that variable's value. Repeat. *This can be a starting point in your analysis, but will lead to errors easily.*
. . .
2. **Functionals** (`_apply`, `map_` functions) allow you to take a function that solves the problem for a single input and generalize it to handle any number of inputs. *This is very popular in R programming culture.*
. . .
3. Use a `for` loop to repeat the chunk of code, and let it loop over the changing variable's value. *This is popular for many programming languages, but the R programming culture encourages a functional way instead*.
## Review of lists
- Remember, lists are the most general data structure
. . .
- We can put anything into them
- Specifically, talking about lists with same things in each slot
- For example:
- a list of file paths
- a list of `data.frame`s
- a list of plots
. . .
- Ideally, we want to apply the same function to them.
## Functionals via `map()`
`map()` takes in a vector or a list, and then applies the function on each element of it. The output is *always* a list.
```r
map(my_vector, log)
^vector ^function
```
```{webr}
my_vector = c(1, 3, 5, 7)
result = map(my_vector, log)
# ^vector. ^function
result
```
. . .
```{webr}
result[[1]]
```
## `purrr::map()`

## Another View of `map()`

## The basic formula
1. Define what you want to do
1. Do it once on test data, write function if necessary
1. Make a list of objects to iterate through
1. Apply function multiple times on the list elements
## 1. Loading up a list of files

## 2. Do it once
We want to load up four data frames in the `data/tumor/` directory using `read_csv`. Let's try doing it for one first:
```{webr}
#| warning: false
#| message: false
list.files("data/tumor", full.names=TRUE)
read_csv("data/tumor/LUSC.csv")
```
## 3. Make a list
Now we build our list by listing the files in `data/tumor/`:
```{webr}
#| warning: false
#| message: false
file_list <- list.files("data/tumor", full.names = TRUE)
file_list
```
## 4. Do it multiple times
Now we can apply `read_csv` to each element in `file_list`. We can load these up by applying `read_csv` on each element of the file list.
Check what `df_list[[1]]` is:
```{webr}
#| warning: false
#| message: false
df_list <- purrr::map(file_list, read_csv)
df_list
```
## Plotting our Data Frames
1. We want to apply a plotting function to every data frame in a list.
2. Write a function called `plot_recurrence`. Try it out with a data.frame
3. Load our data into a list called `df_list` using `read_csv`.
4. Apply our function `plot_recurrence` to `df_list` using `map()`
## 1. Define What we want to do

## 2. Write a function, try it out on one DF
Write a function called `plot_recurrence` that plots `days_to_last_follow_up` vs. `age_at_diagnosis`. Try running it on `lusc_data`
```{webr}
#| exercise: ggplot1
lusc_data <- read_csv("data/tumor/LUSC.csv")
plot_recurrence <- function(df){
ggplot(df) +
aes(x= -------,
y= --------) +
geom_point()
}
plot_recurrence(lusc_data)
```
::: {.solution exercise="ggplot1"}
#### Solution
```{webr}
#| exercise: ggplot1
#| solution: true
plot_recurrence <- function(df){
ggplot(df) +
aes(x= days_to_last_followup,
y= age_at_diagnosis) +
geom_point()
}
plot_recurrence(lusc_data)
```
:::
## 3. Build our list
- We use `read_csv` on our list of file paths.
```{webr}
df_list <- purrr::map(file_list, read_csv)
df_list
```
## 4. Apply our Function to the list
Try applying `plot_recurrence()` to each element of `df_list` using `map()`.
```{webr}
plot_recurrence <- function(df){
ggplot(df) +
aes(x=days_to_last_follow_up,
y=age_at_diagnosis) +
geom_point()
}
plot_list <- map(df_list, plot_recurrence)
```
## Critical Things to Think about:
- What is the unit in the list?
- How do I call a function?
- How do I call extra arguments?
. . .
## Variations of `map()`
To be more specific about the output type, you can do this via the `map_*` function, where `*` specifies the output type: `map_lgl()`, `map_chr()`, and `map_dbl()` functions return vectors of logical values, strings, or numbers respectively.
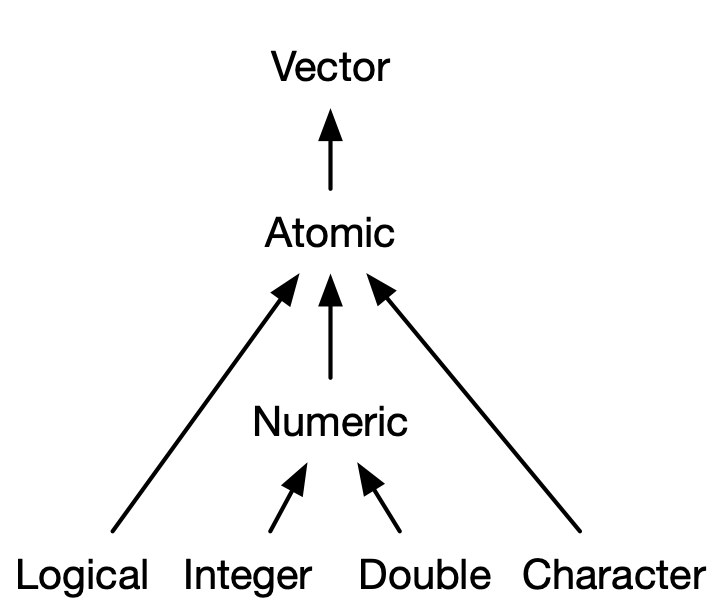{width="300"}
## `map_dbl`
Expects a single `double` return value:
```{webr}
map_dbl(my_vector, log)
```
## `map_lgl`
Expects logical output from each element (`TRUE`, `FALSE`):
```{webr}
map_lgl(penguins, is.numeric)
```
## Case study 3: Iterate over different conditions to analyze a dataframe
Suppose you are working with the `penguins` dataframe:
```{r}
head(penguins)
```
. . .
and you want to look at the mean `bill_length_mm` for each of the three species (Adelie, Chinstrap, Gentoo).
## The Process
1. Define what you want to do
1. Do it once on test data, write function if necessary
1. Make a list of objects to iterate through
1. Apply function multiple times on the list elements
## Step 1: Define what you want to do
We want to look at the mean `bill_length_mm` for each of the three species (Adelie, Chinstrap, Gentoo).
## Step 2: Do it Once
Adapt the below code into a function. Try it out on the first element of `species_to_analyze()`
```{webr}
#| exercise: mr_bill
#first iteration
penguins_subset = filter(penguins, species == "Adelie")
mean(penguins_subset$bill_length_mm, na.rm = TRUE)
analyze_bill <- function(species_to_analyze){
}
analyze_bill("Adelie")
```
::: {.solution exercise="mr_bill"}
#### Solution
```{webr}
#| exercise: mr_bill
#| solution: true
analyze_bill <- function(species_to_analyze){
penguins_subset = filter(penguins, species == "Adelie")
out <- mean(penguins_subset$bill_length_mm, na.rm = TRUE)
return(out)
}
analyze_bill("Adelie")
```
:::
## Step 3: Make a list
- Variable we need to loop through: `c("Adelie", "Chinstrap", "Gentoo")`
```{webr}
species_to_analyze = c("Adelie", "Chinstrap", "Gentoo")
```
## Step 4: Apply function on list elements
- The looping mechanism, and its output: `map_dbl()` outputs (double) numeric vectors.
Apply `analyze_bill` to `species_to_analyze`:
```{webr}
#| exercise: bill_end
map_dbl(-------, analyze_bill)
```
::: {.solution exercise="bill_end"}
#### Solution
```{webr}
#| exercise: bill_end
#| solution: true
map_dbl(-------, analyze_bill)
```
:::
## Map family of functions
{width="400"}
More info at: https://adv-r.hadley.nz/functionals.html
## For loops, briefly
A `for` loop repeats a chunk of code many times, once for each element of an input vector.
```
for (my_element in my_vector) {
chunk of code
}
```
Most often, the "chunk of code" will make use of `my_element`.
. . .
```{r}
my_vector = c(1, 3, 5, 7)
for (my_element in my_vector) {
print(my_element)
}
```
## Loop through the indicies of a vector
```{r}
my_vector = c(1, 3, 5, 7)
seq_along(my_vector)
```
```{r}
for(i in seq_along(my_vector)) {
print(my_vector[i])
}
```
. . .
```{r}
my_vector = c(1, 3, 5, 7)
result = rep(NA, length(my_vector))
for(i in seq_along(my_vector)) {
result[i] = log(my_vector[i])
}
result
```
##