forked from GCDigitalFellows/do-the-r-thing
-
Notifications
You must be signed in to change notification settings - Fork 1
/
Copy pathpresentation.Rmd
406 lines (293 loc) · 11.9 KB
/
presentation.Rmd
1
2
3
4
5
6
7
8
9
10
11
12
13
14
15
16
17
18
19
20
21
22
23
24
25
26
27
28
29
30
31
32
33
34
35
36
37
38
39
40
41
42
43
44
45
46
47
48
49
50
51
52
53
54
55
56
57
58
59
60
61
62
63
64
65
66
67
68
69
70
71
72
73
74
75
76
77
78
79
80
81
82
83
84
85
86
87
88
89
90
91
92
93
94
95
96
97
98
99
100
101
102
103
104
105
106
107
108
109
110
111
112
113
114
115
116
117
118
119
120
121
122
123
124
125
126
127
128
129
130
131
132
133
134
135
136
137
138
139
140
141
142
143
144
145
146
147
148
149
150
151
152
153
154
155
156
157
158
159
160
161
162
163
164
165
166
167
168
169
170
171
172
173
174
175
176
177
178
179
180
181
182
183
184
185
186
187
188
189
190
191
192
193
194
195
196
197
198
199
200
201
202
203
204
205
206
207
208
209
210
211
212
213
214
215
216
217
218
219
220
221
222
223
224
225
226
227
228
229
230
231
232
233
234
235
236
237
238
239
240
241
242
243
244
245
246
247
248
249
250
251
252
253
254
255
256
257
258
259
260
261
262
263
264
265
266
267
268
269
270
271
272
273
274
275
276
277
278
279
280
281
282
283
284
285
286
287
288
289
290
291
292
293
294
295
296
297
298
299
300
301
302
303
304
305
306
307
308
309
310
311
312
313
314
315
316
317
318
319
320
321
322
323
324
325
326
327
328
329
330
331
332
333
334
335
336
337
338
339
340
341
342
343
344
345
346
347
348
349
350
351
352
353
354
355
356
357
358
359
360
361
362
363
364
365
366
367
368
369
370
371
372
373
374
375
376
377
378
379
380
381
382
383
384
385
386
387
388
389
390
391
392
393
394
395
396
397
398
399
400
401
402
403
404
405
406
---
title: "Do the R Thing"
subtitle: "Data analysis with R"
author: Tahir H. Butt <[email protected]>
date: May 10, 2017
output:
ioslides_presentation:
logo: images/gcdi-logo.svg
css: slides.css
self_contained: false
incremental: true
fig_caption: true
---
<!--
http://colorbrewer2.org/#type=qualitative&scheme=Paired&n=6
-->
```{r global_options, echo = FALSE, include = FALSE}
options(width = 999)
```
# Motivation
## Do the Right Thing | Love, don't hate, your data analysis
<div class="columns-2">


</div>
<div class="notes">
> - Is there a *right* way of doing data analysis in R? Why does it even matter?
</div>
## By way of introduction
> - My name is Tahir and I am
> - a doctoral candidate in Urban Education,
> - learned my first programming language (Pascal) in the summer of 1996,
> - studied computational linguistics in college,
> - began programming Python in 2005 at my first real job,
> - began using R in 2009,
> - moved to Python (and Pandas) for data analysis because I hated R,
> - but experimented with R again after many years this past December,
> - and now I have seen the error of my ways.
## Data analysis, brought to you by the letter R

<div class="notes">
> - Q: How many have done data analysis?
> - Q: How many have already some experience with R?
> - I am assuming you at have done data analysis before, not necessarily with R, nor necessarily with prior programming experience.
</div>
## By way of introduction (cont.)
### Analysis of data?
"Procedures for **analyzing** data, techniques for **interpreting** the results of such procedures, ways of planning the **gathering** of data to make its analysis easier, more precise or more accurate, and all the machinery and results of (mathematical) **statistics** which apply to analyzing data." (John W. Tukey, 1961)
### What is R?
R is a **language and environment** for statistical computing and graphics
## New Zealand is for love**R**s
### Where did it come from?
R was created by two **New Zealand** academics named Ross and Robert and released in 1995
### Is R only for Kiwis?
Though it seems to help (e.g., **Hadley Wickham**, more on him later), the benefits of R are universal, transcultural, and, possibly, transhistorical.
## A schematic view for us analysts of data {.flexbox .vcenter}
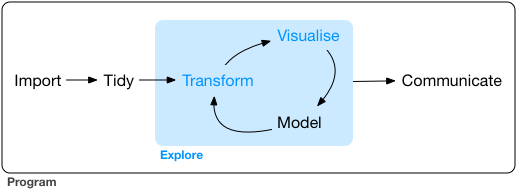
This workshop covers **all but the Model stage** but we will definitely **explore data**.
## Why you use R | Or should, if you are not already
* Because it is **open source and free**, unlike Stata, SAS, SPSS, etc.
* Very good **documentation** and lots of help through [Stack Overflow](https://stackoverflow.com/questions/tagged/r)
* Pretty graphics with the `ggplot2` package
* `install.packages()` many other packages from the Comprehensive R Archive Network ([CRAN](https://cran.r-project.org/))
## But most importantly
* Fascism lost so you don't have to settle for Excel
<div class="centered">

</div>
## How not to teach R
Garrett Grolemund of RStudio has [enumerated](https://rviews.rstudio.com/2017/02/22/how-to-teach-r-common-mistakes/) principles we will follow:
1. Do not teach R as if it were a programming language: empower students to use R for data science
2. Do not avoid the lecture: convey large amounts of information in a short period of time
3. Do not let your workshop become a consulting clinic for installation bugs: provide a classroom RStudio Server for students to use
<div class="notes">
* Come to Digital Fellows office hours for help installing R and RStudio
</div>
# Basics for data analysis
## Welcome to the tidyverse
```{r echo=TRUE,message=FALSE,results='hide',warning=FALSE}
library(tidyverse)
```

<div class="notes">
> - These projects together share a common philosophy that marks an important shift away from the old, and arguably more frustrating, way of doing data analysis in R
</div>
## The tidy data way

<div class="notes">
r4ds suggests three interrelated rules which make a dataset tidy:
> - Each variable must have its own column.
> - Each observation must have its own row.
> - Each value must have its own cell.
</div>
## Importing data
Use `readr` and `readxl` packages
```{r message=FALSE, warning=FALSE, results='hide'}
readr::read_csv('https://data.ny.gov/api/views/28gk-bu58/rows.csv?accessType=DOWNLOAD')
```
```{r message=FALSE, warning=FALSE, results='hide'}
download.file('http://www.equality-of-opportunity.org/data/college/mrc_table1.xlsx',
destfile = 'mrc_table1.xlsx',
method='curl')
readxl::read_excel('mrc_table1.xlsx')
```
<div class="notes">
> - We use the `readr::read_csv()` for CSV files and `readxl::read_excel()` for Excel files
> - Notice `read_csv` can take a url whereas we need to download the excel file first
</div>
## Load up sample data
```{r}
library(nycflights13)
flights[1:5,]
```
<div class="notes">
> - We are going to load flight data and inspect the first five rows
</div>
## Pipe it like it's hot
<div class="columns-2">

> - a pipe is expressed by `%>%` from the `magittr` package
> - clearly expresses a sequence of operations
> - even more powerful when used as part of `tidyverse`
</div>
## Selecting and transforming data
```{r}
flights %>%
mutate(date = sprintf('%d-%.2d-%.2d', year, month, day)) %>%
select(date, air_time, distance) %>%
separate(date, "-", into=c("year", "month", "day"), remove=FALSE) %>%
head(5)
```
<div class="notes">
> - `mutate()` creates new variables
> - `select()` selects variables
> - `separate()` turns a single chr variable into multiple (opposite `unite` can replace `mutate`)
> - We never change the state of the program, `flights` is not mutated even though we call `mutate`
> - `remove=FALSE` there so we can see what we created in the previous step
> - `mutate` and `select` from `dplyr` whereas `separate` from `tidyr`
</div>
## Filtering and ordering data
```{r}
flights %>%
filter(day < 8) %>%
arrange(-air_time,distance) %>%
select(carrier, flight, air_time, distance) %>%
head(5)
```
<div class="notes">
> - `filter()` reduces the number of observations using a matching condition
> - `arrange()` order data by the value of particular variables
> - `day` variable is of time `<int>` so we can be sure this matching condition
> - The use of the negative sign (`-`) in the `arrange` function before a variable specifies that we want to order the data in descending order for that variable. Here we have combined both ascending and descending ordering.
</div>
## Tidying your data
- The "tidy" principle is one observation per row and one variable per column
- But data is often not organized the way your analysis requires
## Tidying example: what you get
```{r}
table4a
```
## Tidying example: what you wanted
```{r}
table4a %>% gather(`1999`, `2000`, key = "year", value = "cases")
```
If you had many columns to gather, the following is equivalent:
```{r echo=TRUE,results='hide'}
table4a %>% gather(-country, key = "year", value = "cases")
```
<div class="notes">
> - `-country` selects all columns but `country`
> - `spread` is the opposite of `gather` so can be used when the data you have is currently in a "long" rather than a "wide" format
</div>
## Let's get statistical
```{r echo=TRUE}
flights %>% summarise(max(air_time, na.rm=TRUE))
```
```{r echo=TRUE}
flights %>%
summarise(avg_time = mean(air_time, na.rm=TRUE),
avg_speed = mean(distance/air_time, na.rm=TRUE))
```
<div class="notes">
> - remember you always have to deal with how to handle `NA` values
> - easy to add multiple summarized variable based on multiple variable
> - also can get summary statistics with `flights %>% summary`
</div>
## Get it together: weather
```{r}
weather %>%
filter(origin == 'EWR') %>%
head(5)
```
## Get it together: weather and flights
```{r}
flightsweather <- flights %>%
left_join(weather, by = c("origin", "year", "month", "day", "hour")) %>%
select(origin, dep_delay, wind_speed)
flightsweather %>%
head(5)
```
<div class="notes">
> - We will save the joined dataset for future work
</div>
## Explore by visualizing
```{r warning=FALSE,message=FALSE,fig.height=3}
flightsweather %>%
ggplot(aes(x=wind_speed, y=dep_delay)) +
geom_point()
```
<div class="notes">
> - Introduce `ggplot2`
> - We can see roughly that with higher values of `visib` there were longer departure delays
</div>
## More than just pretty graphics
```{r warning=FALSE,message=FALSE,fig.height=3}
flightsweather %>%
filter(wind_speed < 250) %>%
ggplot(aes(x=wind_speed, y=dep_delay)) +
geom_point(aes(color = origin)) +
geom_smooth()
```
<div class="notes">
> - Remove outliers
> - Color points by origin
> - Not an obvious relationship visible between these two variables
</div>
## Exploring groups of data as facets
```{r warning=FALSE,message=FALSE,fig.height=3}
flightsweather %>%
filter(wind_speed < 250) %>%
ggplot(aes(x=wind_speed, y=dep_delay)) +
geom_point(aes(color = origin)) +
geom_smooth() +
facet_wrap(~ origin)
```
# Let's hit the gym
## First, stretch
Take a five minute break.
<div class="notes">
> - Write up IP address, login, password
> - Make sure assistants are ready to help students
</div>
## Proper gym equipment | RStudio
> - Turn on your computers
> - Connect to gcdf WiFi network with password provided
> - Open your web browser to web address provided
> - Login with user and password provided
> - Create New Session
<div class="notes">
> - Project myself logging in
</div>
## Using the free weights | The R Console
```{r echo=TRUE,results='hide'}
sessionInfo()
```
```
R version 3.4.0 (2017-04-21)
Platform: x86_64-pc-linux-gnu (64-bit)
Running under: Debian GNU/Linux 8 (jessie)
Matrix products: default
BLAS/LAPACK: /usr/lib/libopenblasp-r0.2.12.so
locale:
[1] LC_CTYPE=en_US.UTF-8 LC_NUMERIC=C LC_TIME=en_US.UTF-8
[4] LC_COLLATE=en_US.UTF-8 LC_MONETARY=en_US.UTF-8 LC_MESSAGES=C
[7] LC_PAPER=en_US.UTF-8 LC_NAME=C LC_ADDRESS=C
....
```
## Gym etiquette | Create an R project

> - New Project > New Directory > Empty Project
> - Enter "[LAST]-[FIRST]" in Directory Name
> - Create Project
## Lifting log | Start a new R Notebook
An R **Notebook** is an R **Markdown** document with chunks that can be executed **independently** and **interactively**, with output visible immediately beneath the input ([rstudio.com](http://rmarkdown.rstudio.com/r_notebooks.html))
> - File > New File > R Notebook
```
---
title: "My Notebook"
output: html_notebook
---
```
## What’s your max, bro? | Keeping research reproducible
R Notebooks are a method of **literate programming** that allows for direct interaction with R while producing **a reproducible document** with publication-quality output ([rstudio.com](http://rmarkdown.rstudio.com/r_notebooks.html)). This presentation is actually written in R Markdown, so the output of a block of code can be included in the resulting document.
```{r fig.width=4,fig.height=1.5}
library(ggplot2)
data(iris)
ggplot(data=iris, aes(x=Sepal.Length, y=Sepal.Width)) + geom_point()
```
## Let me spot you | Go to your empty R Notebook
<div class="notes">
- We will be importing data recently collected as part of a large research project. This data measured student earnings as an outcome of college education.
-
</div>