-
Notifications
You must be signed in to change notification settings - Fork 33
New issue
Have a question about this project? Sign up for a free GitHub account to open an issue and contact its maintainers and the community.
By clicking “Sign up for GitHub”, you agree to our terms of service and privacy statement. We’ll occasionally send you account related emails.
Already on GitHub? Sign in to your account
Replace deprecated SciPy cwt with PyWavelets cwt #913
base: main
Are you sure you want to change the base?
Conversation
… conda env yml files and `pyproject.toml`
| widths = deg / (2 * np.pi / period) | ||
|
|
||
| widths = deg / (2 * np.pi * freq) | ||
| cwtmatr = scipy.signal.cwt(data, scipy.signal.morlet2, widths=widths, w=deg) | ||
| psd = np.mean(np.square(np.abs(cwtmatr)), axis=1) | ||
| [cfs, freq] = pywt.cwt(data, scales=widths, wavelet="cmor1.5-1.0") | ||
| psd = np.mean(np.square(np.abs(cfs)), axis=1) | ||
| period = 1 / freq |
There was a problem hiding this comment.
Choose a reason for hiding this comment
The reason will be displayed to describe this comment to others. Learn more.
Code changes are based on this comment
There was a problem hiding this comment.
Choose a reason for hiding this comment
The reason will be displayed to describe this comment to others. Learn more.
@chengzhuzhang The integration tests still pass. I will do a regression test to compare against v2.12.1 when Perlmutter is back online.
| widths = deg / (2 * np.pi / period) | ||
|
|
||
| widths = deg / (2 * np.pi * freq) | ||
| cwtmatr = scipy.signal.cwt(data, scipy.signal.morlet2, widths=widths, w=deg) | ||
| psd = np.mean(np.square(np.abs(cwtmatr)), axis=1) | ||
| [cfs, freq] = pywt.cwt(data, scales=widths, wavelet="cmor1.5-1.0") | ||
| psd = np.mean(np.square(np.abs(cfs)), axis=1) | ||
| period = 1 / freq | ||
|
|
||
| return (period, psd) |
There was a problem hiding this comment.
Choose a reason for hiding this comment
The reason will be displayed to describe this comment to others. Learn more.
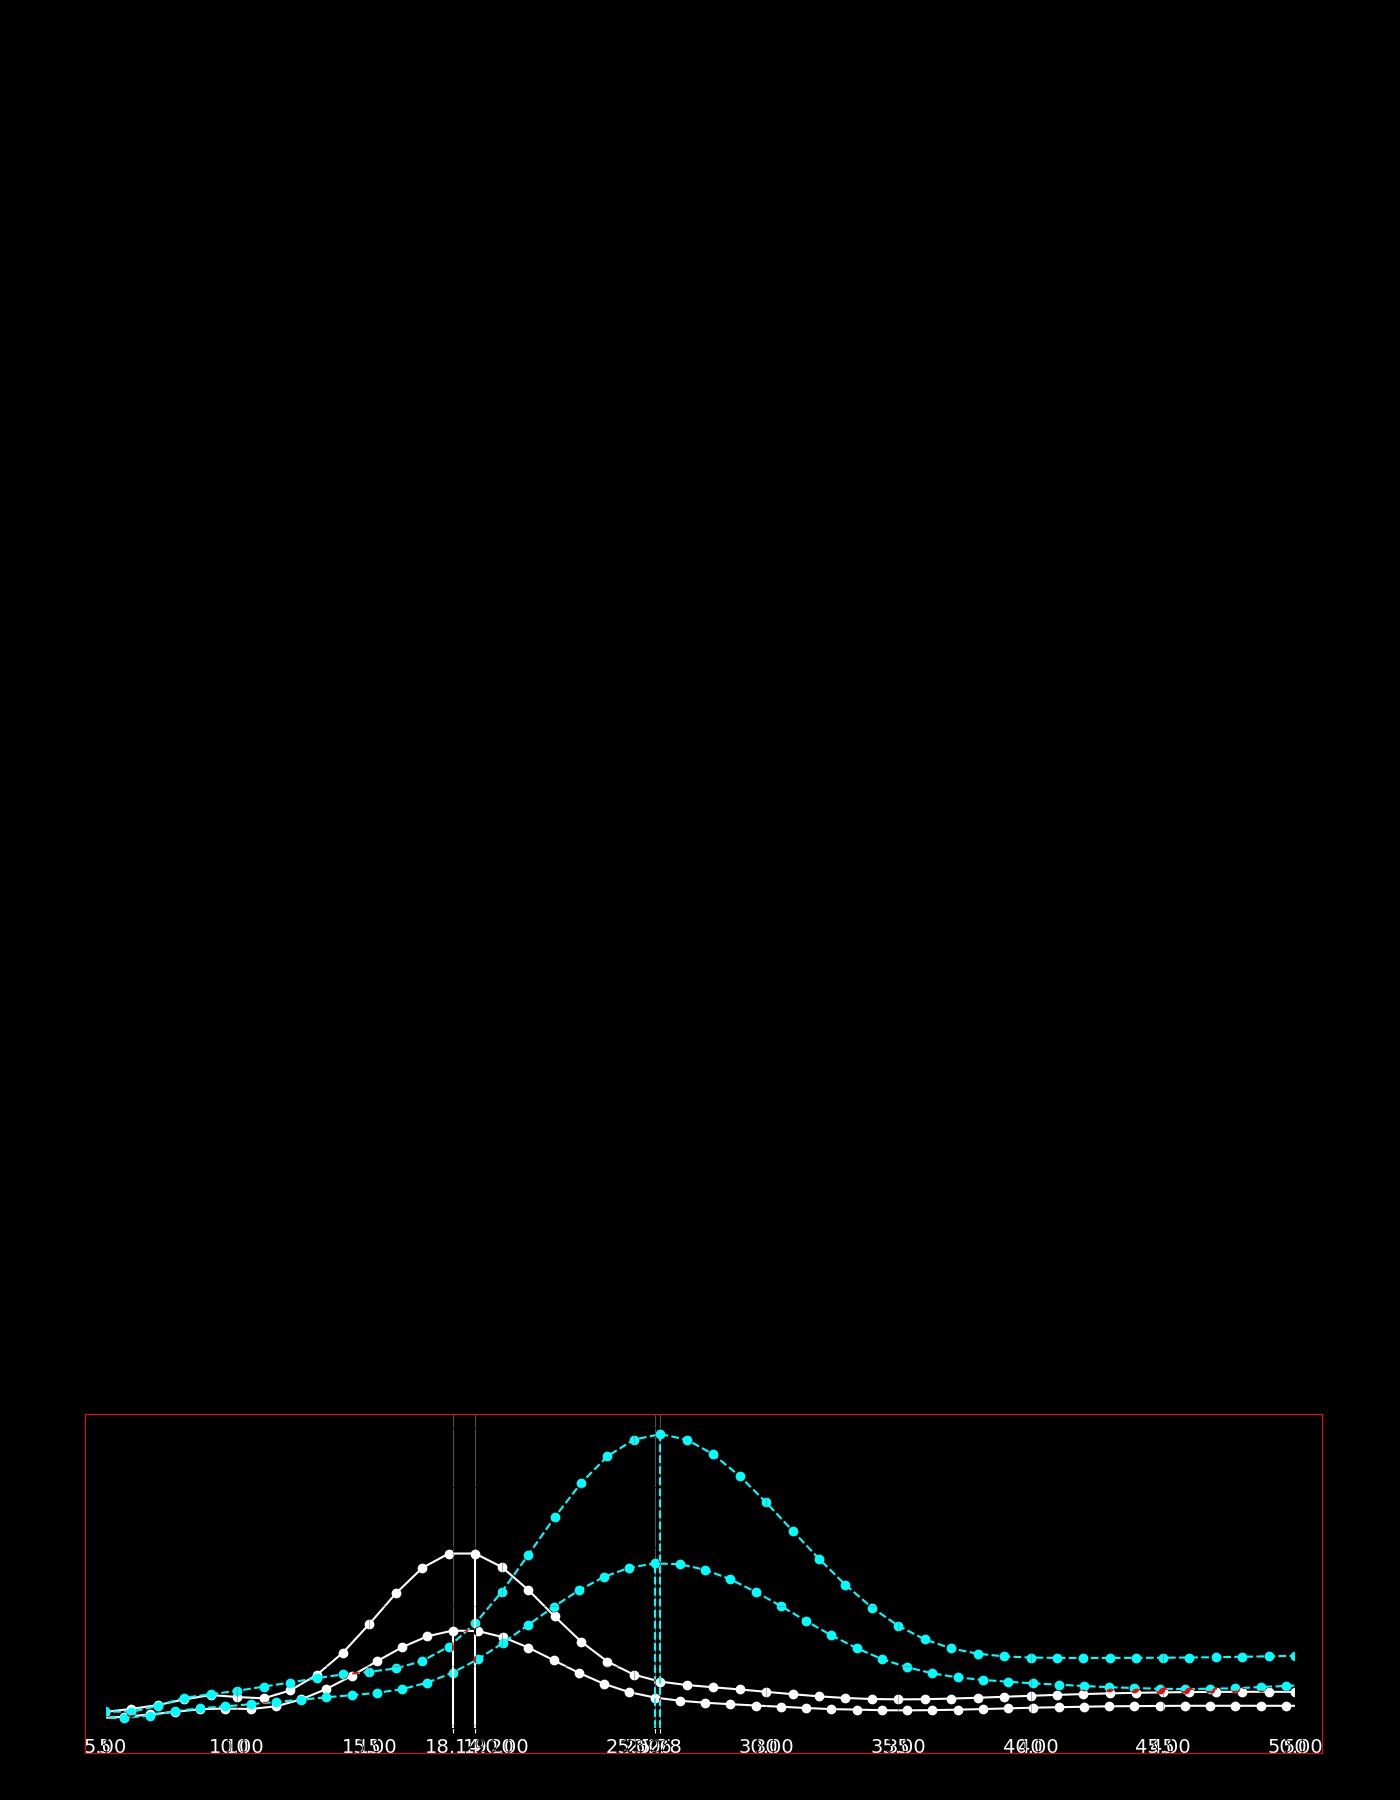
Hey @chengzhuzhang, regression testing is complete with the code changes. I'm finding large differences with the QBO wavelet plots, specifically affected by the function return values of (period, psd).
| Dev | Main | Diff |
|---|---|---|
 |
 |
 |
Let's push this PR back to the E3SM-Unified RC testing period for more debugging and proceed with releasing v3.0.0rc1 (pending #880).
There was a problem hiding this comment.
Choose a reason for hiding this comment
The reason will be displayed to describe this comment to others. Learn more.
I agree, we need some review and fine-tuning. Aiming for next rc is reasonable.
There was a problem hiding this comment.
Choose a reason for hiding this comment
The reason will be displayed to describe this comment to others. Learn more.
@tomvothecoder the magnitude change seems consistent with what I found comparing these methods.
Is the period actually different? It looks like it's the same, but the x-axis on the diff plot is hard to read, so I can't figure out what I'm looking at.
There was a problem hiding this comment.
Choose a reason for hiding this comment
The reason will be displayed to describe this comment to others. Learn more.
Our expert is here. I think the period is the same. We just need to use integer as X-axis label to be clear. Should we adjust Y axis range (variance) @whannah1
There was a problem hiding this comment.
Choose a reason for hiding this comment
The reason will be displayed to describe this comment to others. Learn more.
A larger Y-axis range is probably a good idea
There was a problem hiding this comment.
Choose a reason for hiding this comment
The reason will be displayed to describe this comment to others. Learn more.
Is the period actually different? It looks like it's the same, but the x-axis on the diff plot is hard to read, so I can't figure out what I'm looking at.
The wave period is slightly different between the code.
PyWavelets (converted from float64 to int64)
array([ 0,  1,  2,  3,  4,  5,  6,  7,  8,  9, 10, 11, 12, 13, 14, 15, 16,
       17, 18, 19, 20, 21, 21, 22, 23, 24, 25, 26, 27, 28, 29, 30, 31, 32,
       33, 34, 35, 36, 37, 38, 39, 40, 41, 42, 42, 43, 44, 45, 46, 47, 48,
       49, 50, 51, 52])
SciPy
array([ 1,  2,  3,  4,  5,  6,  7,  8,  9, 10, 11, 12, 13, 14, 15, 16, 17,
       18, 19, 20, 21, 22, 23, 24, 25, 26, 27, 28, 29, 30, 31, 32, 33, 34,
       35, 36, 37, 38, 39, 40, 41, 42, 43, 44, 45, 46, 47, 48, 49, 50, 51,
52, 53, 54, 55])There was a problem hiding this comment.
Choose a reason for hiding this comment
The reason will be displayed to describe this comment to others. Learn more.
oh weird, I don't remember seeing that before... 🤔
There was a problem hiding this comment.
Choose a reason for hiding this comment
The reason will be displayed to describe this comment to others. Learn more.
Hmm in your original function below I noticed you have longest_period defined and period defined twice.
def get_psd_from_wavelet_pywt(data):
   deg = 6
   period = np.arange(1, longest_period + 1)
   widths = deg / ( 2 * np.pi / period )
   [cfs, freq] = pywt.cwt(data, scales=widths, wavelet='cmor1.5-1.0')
   psd = np.mean( np.square( np.abs(cfs) ), axis=1)
   period = 1 / freq
   return (period, psd)
While in the e3sm_diags codebase we have period defined only once with 55 set in place of longest_period.
period = np.arange(1, 55 + 1)
Description
AttributeError: module 'scipy.signal' has no attribute 'cwt'(deprecated, use PyWavelets instead) #912Checklist
If applicable: