You signed in with another tab or window. Reload to refresh your session.You signed out in another tab or window. Reload to refresh your session.You switched accounts on another tab or window. Reload to refresh your session.Dismiss alert
Make sure to finish and commit your solution to last week's Citibike modeling problem, with a new Rmd file that loads the 2015 weather and trip data, makes predictions using your model, and summarizes the model's performance
Assume you're given D documents that contain words from a vocabulary of total size V, and that documents contain w words, on average. For instance, you might have D = 1,000 emails that are labeled spam or not spam, with a vocabulary of V = 100,000 possible words, where emails contains 100 words, on average.
What is the running time for estimating the parameters for version of naive Bayes described in the slides?
What are the space requirements?
What is the cost of making a prediction on a new document once you've estimated the paramters?
State all of your answers in terms of D, V, and w.
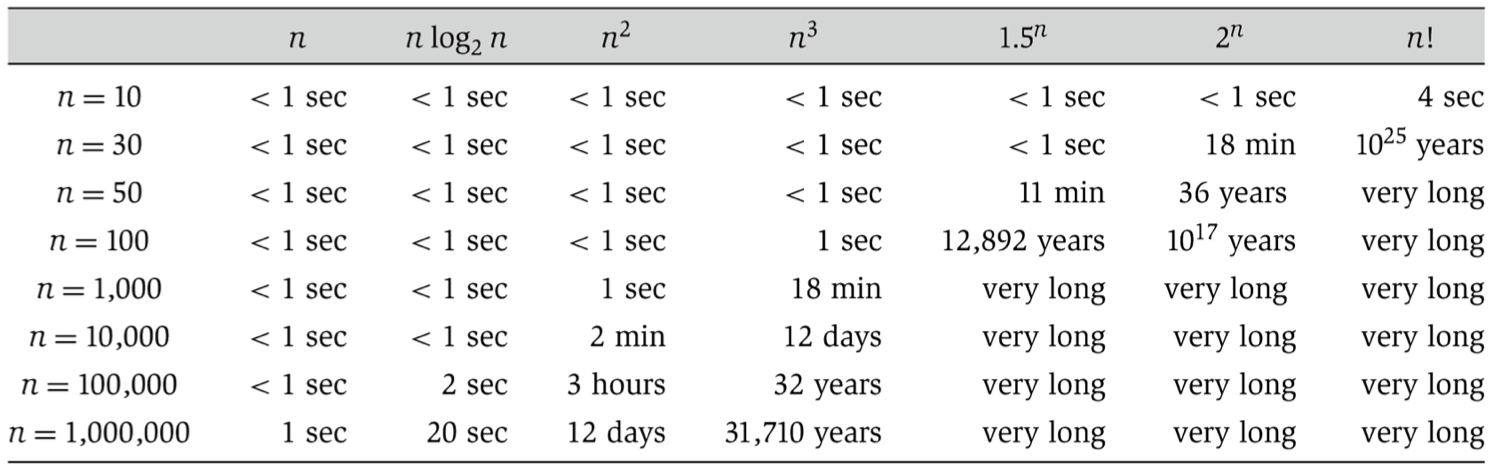
Computational Complexity
Sid Sen gave a guest lecture on computational complexity, data structures, and algorithms. Some references:
Do this logistic regression lab using copies of the lending_club_cleaned.csv (source) and titanic_train.csv (source) datasets that are checked into this repo
Day 3
See code from class for plotting logit models (preview output here)
Review the slides on causality and randomized experiments
See the references in this post for more on the reproducibility crisis
Causality and Experiments
Review chapter 12 of Intro to Statistical Thinking (IST) and do question 12.1
Review chapter 13 of IST and do question 13.1. Answer the following two additional questions for this problem:
Make a plot of the distribution of outcomes (change) split by the treatment (active), similar to this plot
Estimate the effect size by calculating Cohen's d. Think about whether the effect seems practically meaningful.
Day 4
See the slides on causal inference from observational data and natural experiments